StatCounter Analytics 2.1.2
Does StatCounter Analytics work with WordPress 7.0 and PHP 8.1.12? A smoke test was performed on .
Summary
| No PHP errors, warnings or notices | |
| No JavaScript exceptions | |
| All test pages loaded successfully | |
| No resource errors | |
| Looks good! No problems were detected. |
Memory usage: 7.9 KiB
The average PHP memory usage increased by this amount after activating by the plugin.
Page speed impact:
insignificant.
The plugin didn't make the site noticeably slower.
| WordPress version | 7.0 |
|---|---|
| PHP version | 8.1.12 |
| MySQL version | 10.6.10 |
| PHP memory limit | 512M |
| Last updated | |
|---|---|
| Active installs | 70,000+ |
| WordPress.org page | https://wordpress.org/plugins/official-statcounter-plugin-for-wordpress/ |
| Badges |
|


Pages 5
Plugins ‹ Test site — WordPress
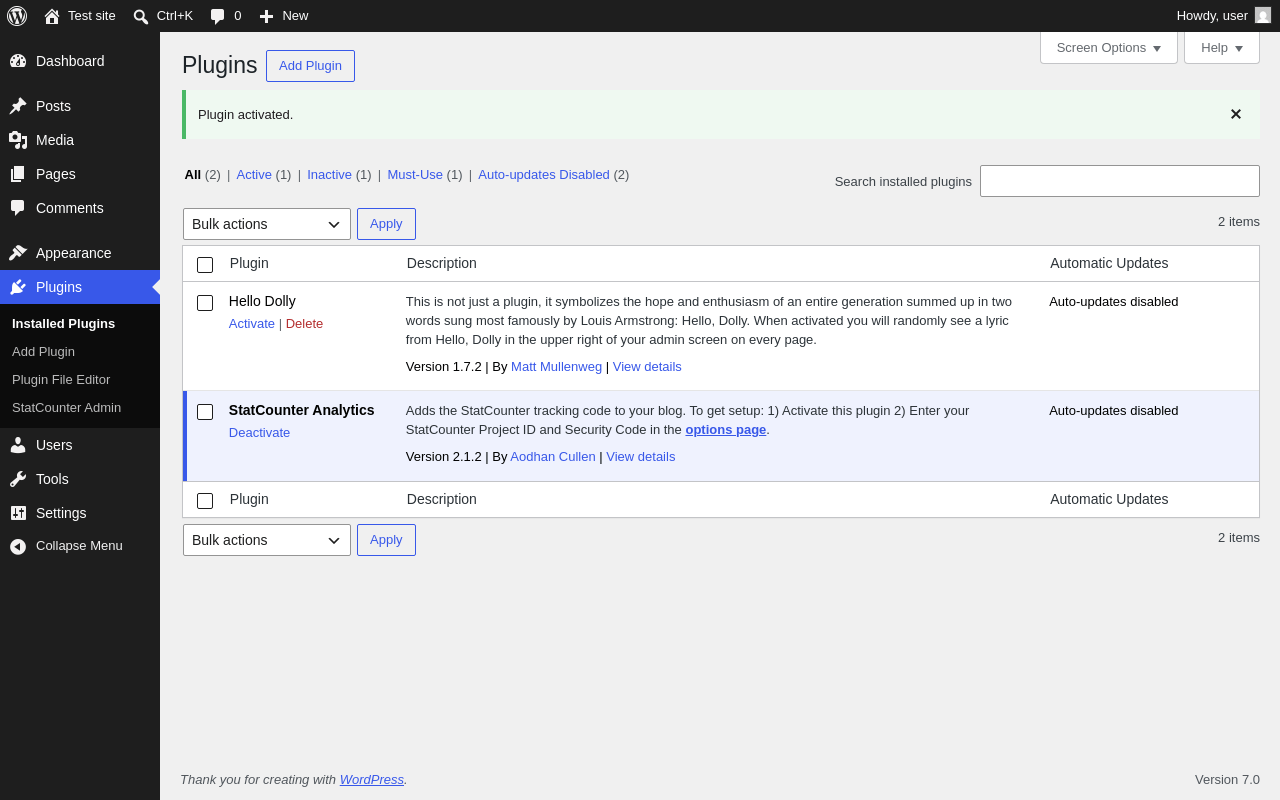
| URL | /wp-admin/plugins.php?plugin_status=all&paged=1&s |
|---|---|
| Requested URL | /wp-admin/plugins.php?action=activate&plugin=official-statcounter-plugin-for-wordpress%2FStatCounter-Wordpress-Plugin.php&plugin_status=all&paged=1&s&_wpnonce=4c53640694 |
| Aspect | after-activation |
| HTTP status | 200 |
| Load time | 0.973 s |
| Memory usage | 3.9 MiB |
| JS errors | None |
| Resource errors | None |
Dashboard → StatCounter Stats
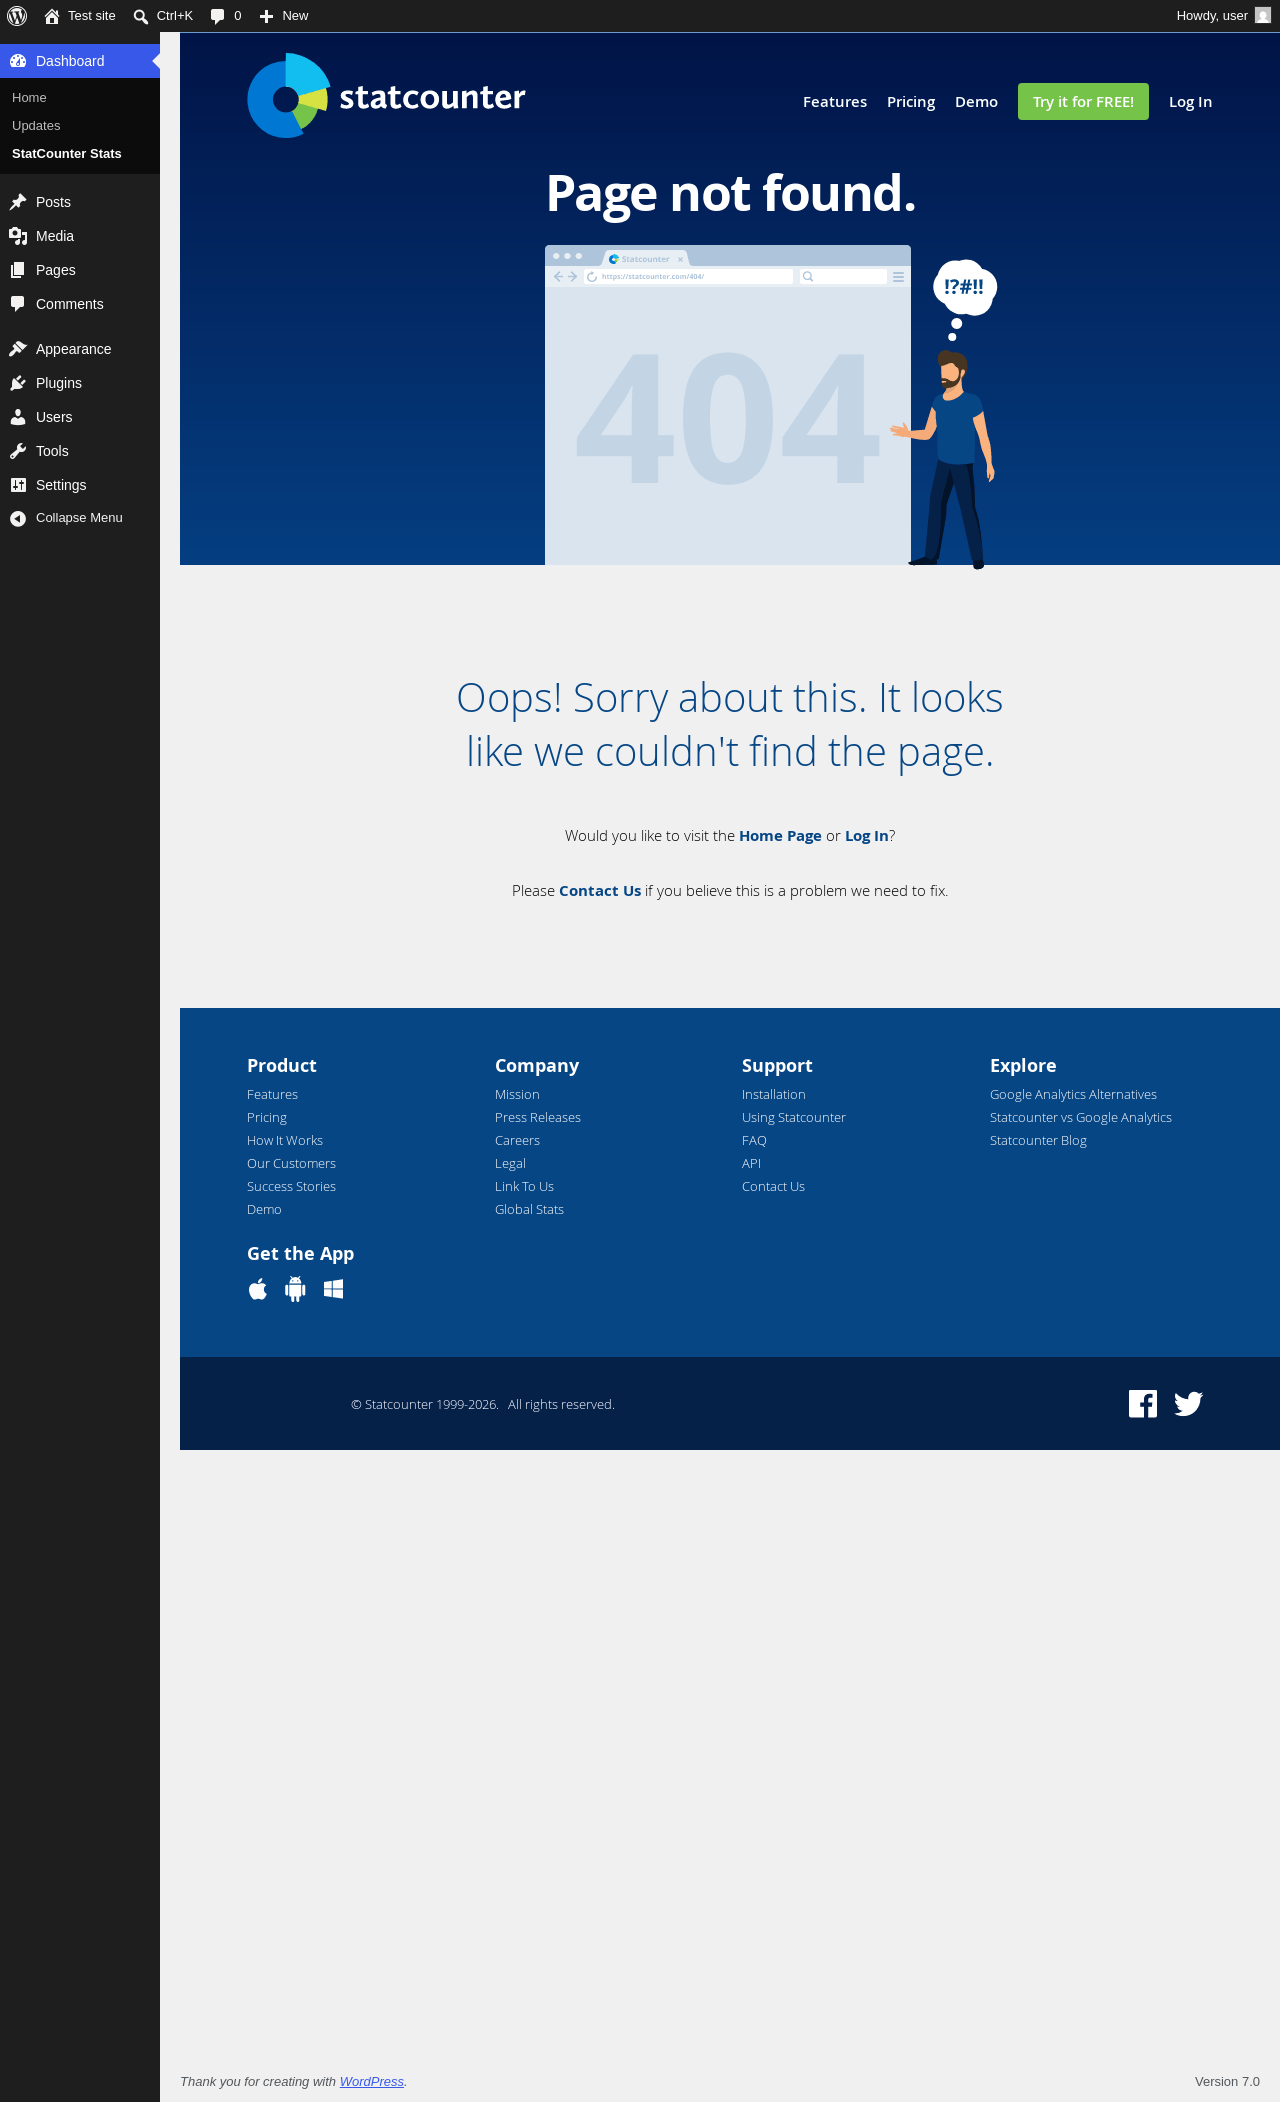
| URL | /wp-admin/index.php?page=statcounter-stats |
|---|---|
| Aspect | menu-item |
| HTTP status | 200 |
| Load time | 1.291 s |
| Memory usage | 3.86 MiB |
| JS errors | None |
| Resource errors | None |
Plugins → StatCounter Admin
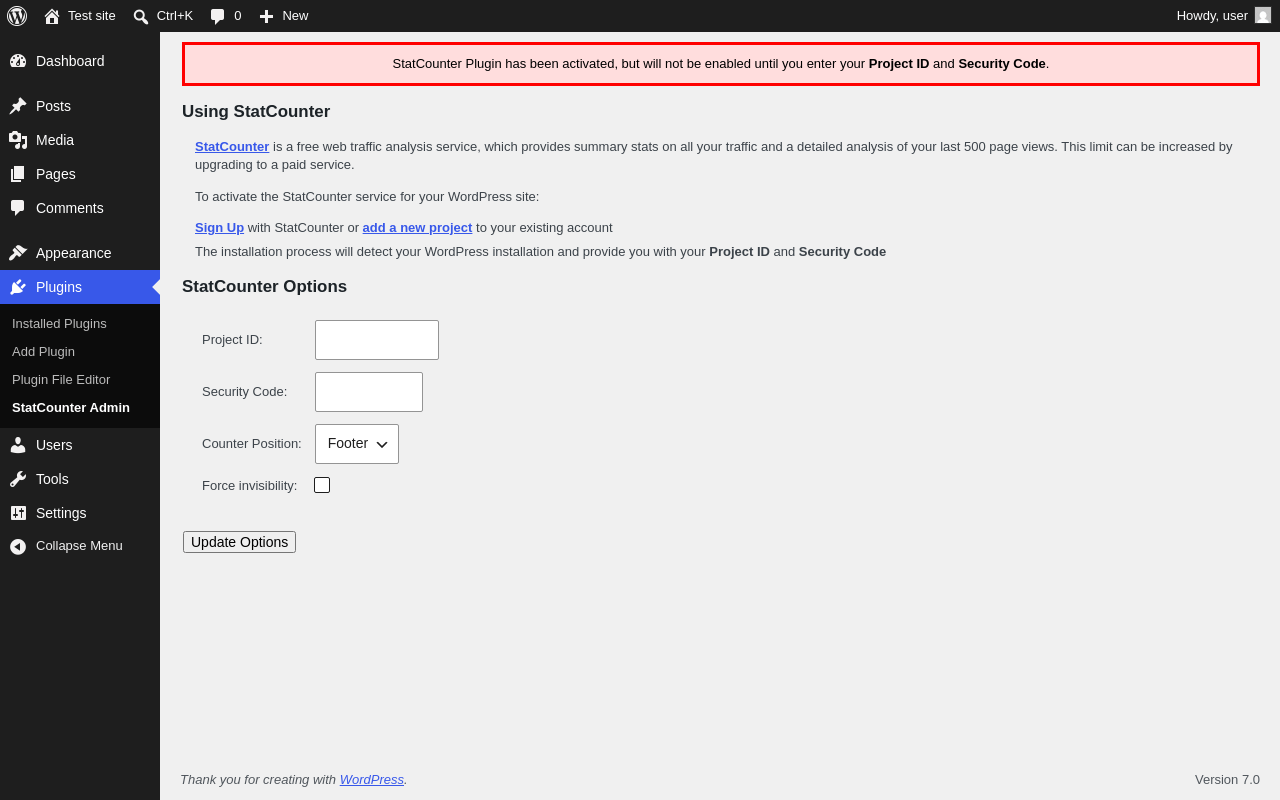
| URL | /wp-admin/plugins.php?page=statcounter-options |
|---|---|
| Aspect | menu-item |
| HTTP status | 200 |
| Load time | 0.502 s |
| Memory usage | 3.86 MiB |
| JS errors | None |
| Resource errors | None |
Settings → StatCounter
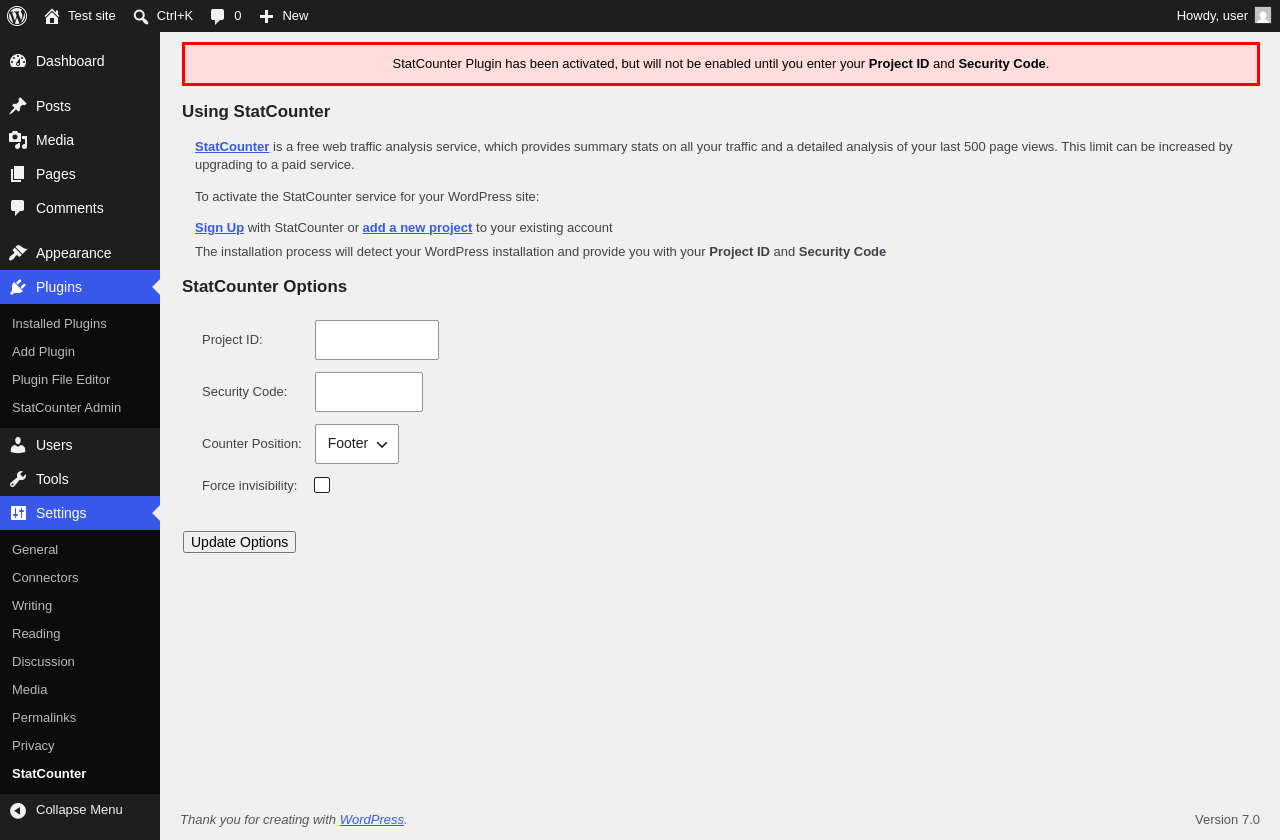
| URL | /wp-admin/options-general.php?page=statcounter-options |
|---|---|
| Aspect | menu-item |
| HTTP status | 200 |
| Load time | 0.675 s |
| Memory usage | 3.89 MiB |
| JS errors | None |
| Resource errors | None |
Test site – Just another WordPress site
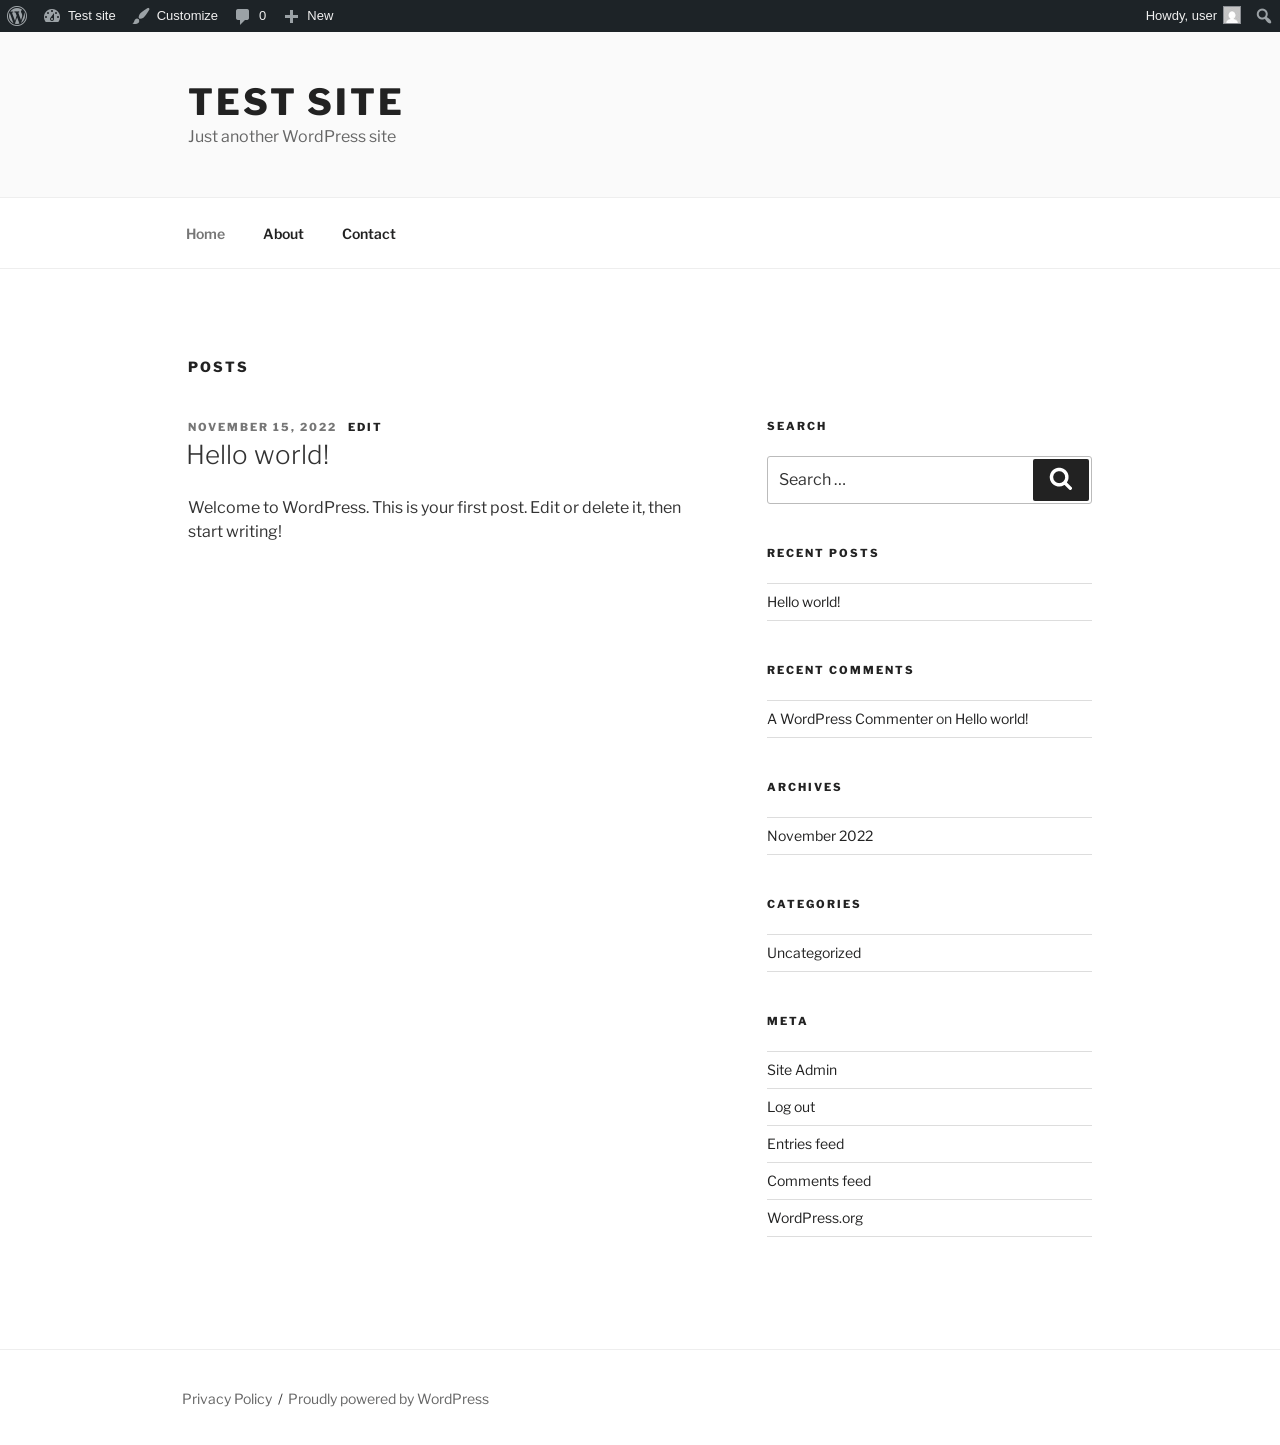
| URL | / |
|---|---|
| Aspect | front-page |
| HTTP status | 200 |
| Load time | 0.247 s |
| Memory usage | 4.23 MiB |
| JS errors | None |
| Resource errors | None |
Benchmark
| URL | Load time | Memory usage | ||||
|---|---|---|---|---|---|---|
| Inactive | Active | Change | Inactive | Active | Change | |
| /wp-admin/index.php | 0.716 s | 0.724 s | +0.008 s | 3.92 MiB | 3.94 MiB | + 15.54 KiB |
| /wp-admin/edit.php | 0.588 s | 0.527 s | -0.061 s | 3.98 MiB | 4 MiB | + 15.46 KiB |
| /wp-admin/post-new.php | 2.158 s | 1.900 s | -0.258 s | 6.56 MiB | 6.58 MiB | + 19.84 KiB |
| /wp-admin/upload.php | 0.765 s | 0.700 s | -0.065 s | 3.89 MiB | 3.89 MiB | - 2.68 KiB |
| /wp-admin/options-writing.php | 0.625 s | 0.561 s | -0.064 s | 3.86 MiB | 3.86 MiB | + 1.31 KiB |
| /wp-admin/media-new.php | 0.675 s | 0.926 s | +0.251 s | 3.85 MiB | 3.86 MiB | + 9.45 KiB |
| /wp-admin/edit-tags.php?taxonomy=category | 0.546 s | 0.575 s | +0.029 s | 3.86 MiB | 3.88 MiB | + 14.63 KiB |
| /wp-admin/post-new.php?post_type=page | 1.858 s | 1.715 s | -0.143 s | 6.55 MiB | 6.56 MiB | + 10.89 KiB |
| /wp-admin/options-discussion.php | 0.591 s | 0.634 s | +0.043 s | 3.86 MiB | 3.86 MiB | - 2.19 KiB |
| /wp-admin/edit-comments.php | 0.553 s | 0.555 s | +0.002 s | 3.88 MiB | 3.88 MiB | - 1.97 KiB |
| / | 0.334 s | 0.205 s | -0.129 s | 4.23 MiB | 4.23 MiB | + 6.57 KiB |
| Average | 0.855 s | 0.820 s | -0.035 s | 4.41 MiB | 4.41 MiB | + 7.9 KiB |
Code Statistics
Note: Third-party libraries and minified JS/CSS files are excluded from these statistics where possible, so the numbers you see here may be lower than those reported by other tools.
| Language | % | Lines of code | Comment lines | Files | |
|---|---|---|---|---|---|
| PHP | 100.0% | 231 | 37 | 1 | |
| Total | 231 | 37 | 1 | ||
PHP Code Analysis | More results »
| Lines of code | 232 |
|---|---|
| Total complexity | 43 |
| Median class complexity | 0.0 |
| Median method complexity | 0.0 |
| Most complex class | — |
| Most complex function | statcounter_options_page() |
| Classes | 0 |
|---|---|
| Methods | 0 |
| Functions | 11 |
Additions
Things that the plugin adds to the site. This section is not intended to be comprehensive. The test tool only looks for a few specific types of added content.
Options wp_options 3
- key_sc_security
- sc_invisible
- sc_project
PHP Error Log
The log file is empty.