OOPVulns: Vulnerability Scanner 1.1.0
Does "OOPVulns - Vulnerability Scanner" work with WordPress 6.9.4 and PHP 8.1.12? A smoke test was performed on .
Summary
| No PHP errors, warnings or notices | |
| No JavaScript exceptions | |
| All test pages loaded successfully | |
| No resource errors | |
| Looks good! No problems were detected. |
Memory usage: 32.53 KiB
The average PHP memory usage increased by this amount after activating by the plugin.
Page speed impact:
0.039 seconds
The average page load time increased by this amount after activating the plugin.
| WordPress version | 6.9.4 |
|---|---|
| PHP version | 8.1.12 |
| MySQL version | 10.6.10 |
| PHP memory limit | 512M |
| Last updated | |
|---|---|
| Active installs | 50+ |
| WordPress.org page | https://wordpress.org/plugins/oopvulns-vulnerability-scanner/ |
| Badges |
|
Pages 4
Plugins ‹ Test site — WordPress
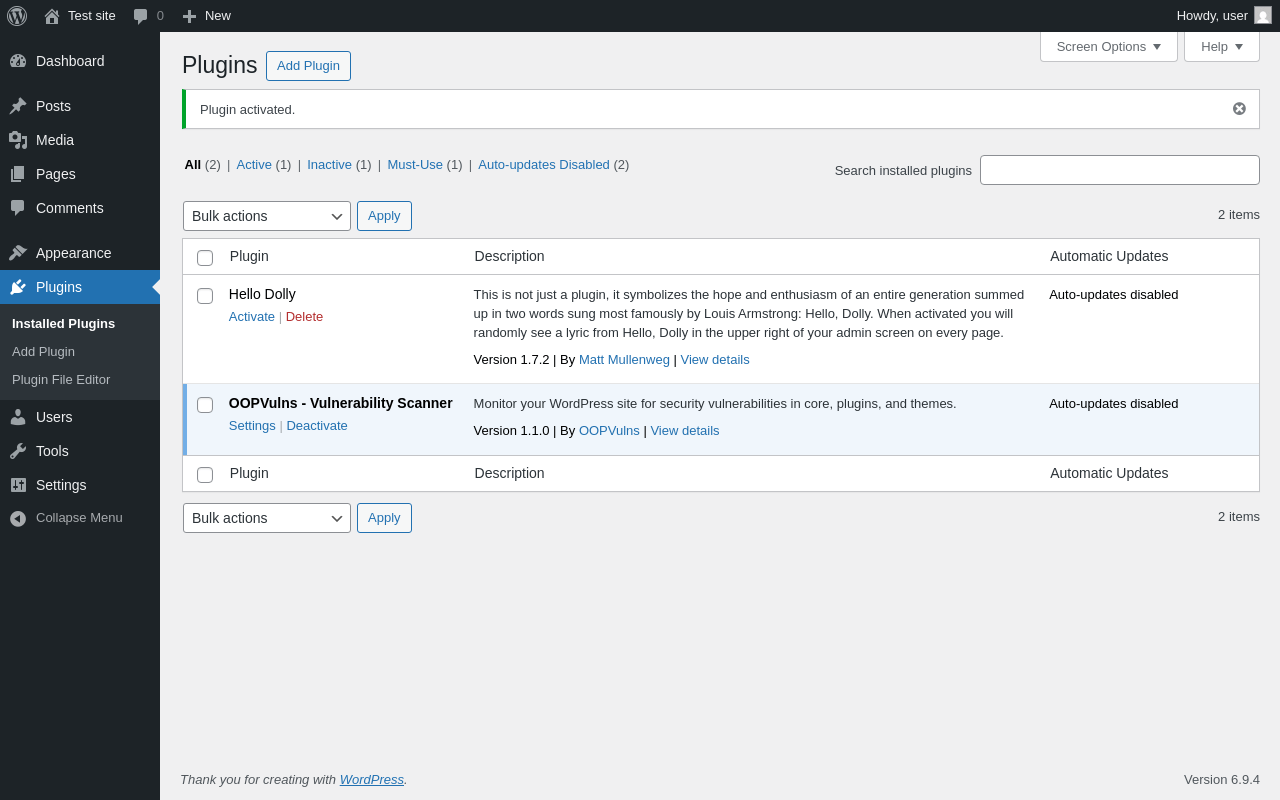
| URL | /wp-admin/plugins.php?plugin_status=all&paged=1&s |
|---|---|
| Requested URL | /wp-admin/plugins.php?action=activate&plugin=oopvulns-vulnerability-scanner%2Foopspam-vulnerability-scanner.php&plugin_status=all&paged=1&s&_wpnonce=ce173b8732 |
| Aspect | after-activation |
| HTTP status | 200 |
| Load time | 0.318 s |
| Memory usage | 3.78 MiB |
| JS errors | None |
| Resource errors | None |
Tools → Vulnerability Scanner
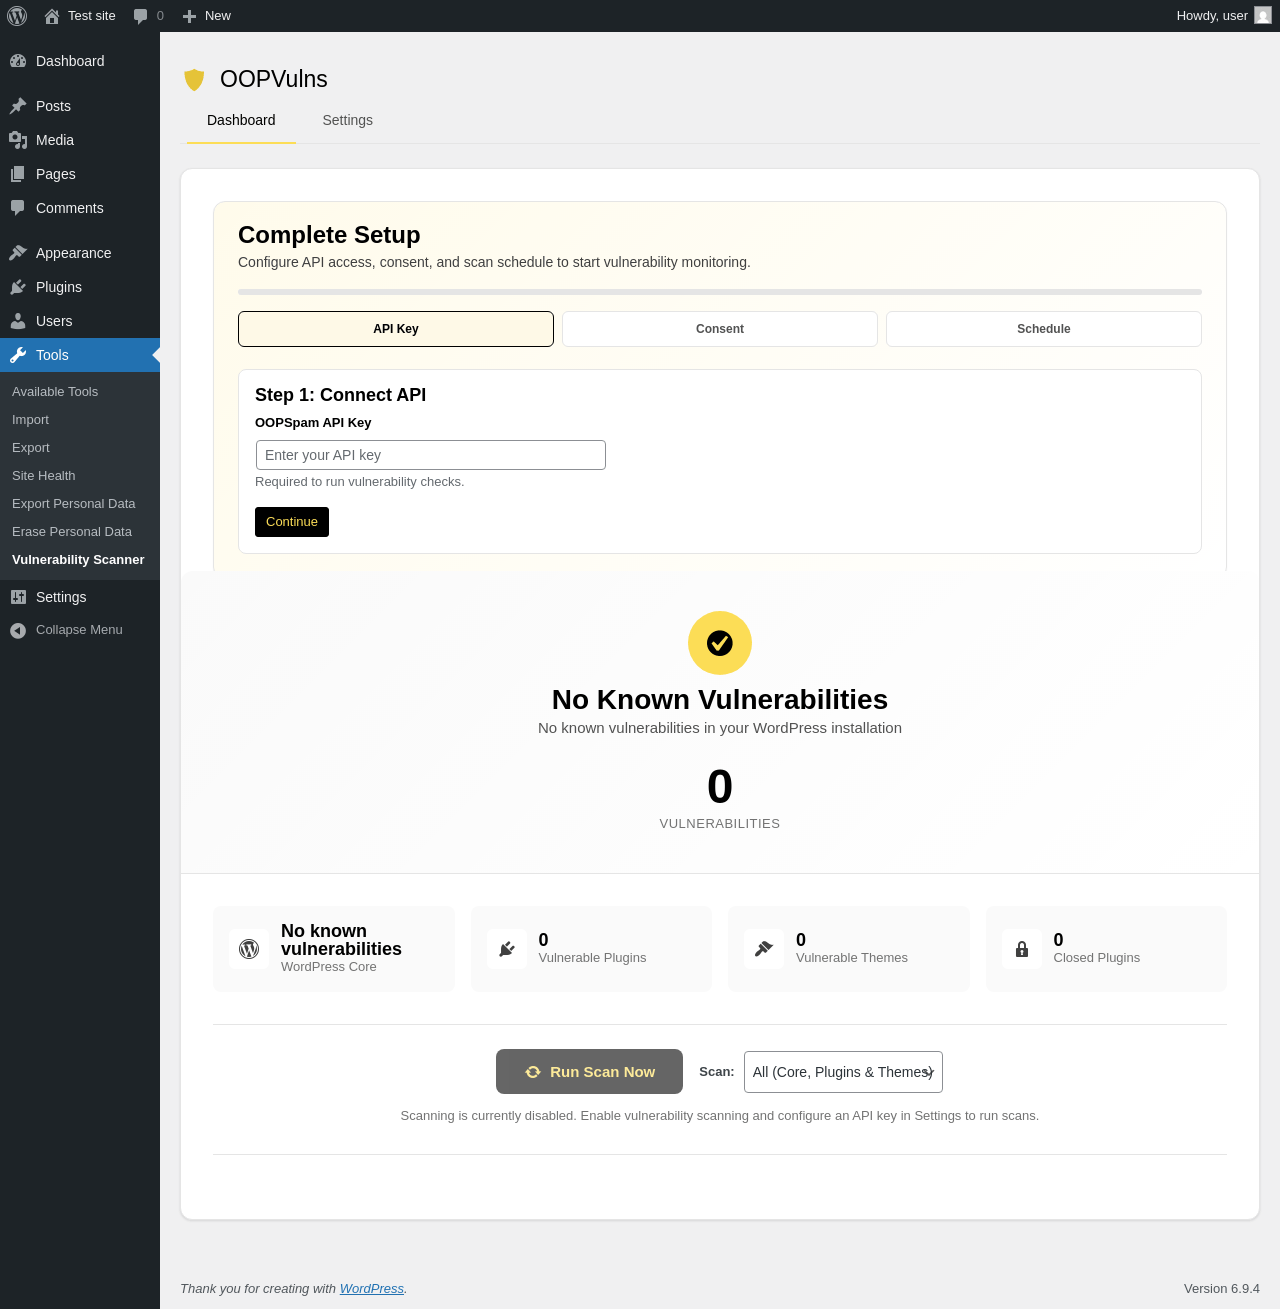
| URL | /wp-admin/tools.php?page=oopvulns-vulnerability-scanner |
|---|---|
| Aspect | menu-item |
| HTTP status | 200 |
| Load time | 0.307 s |
| Memory usage | 3.75 MiB |
| JS errors | None |
| Resource errors | None |
Tools → Vulnerability Scanner → Settings
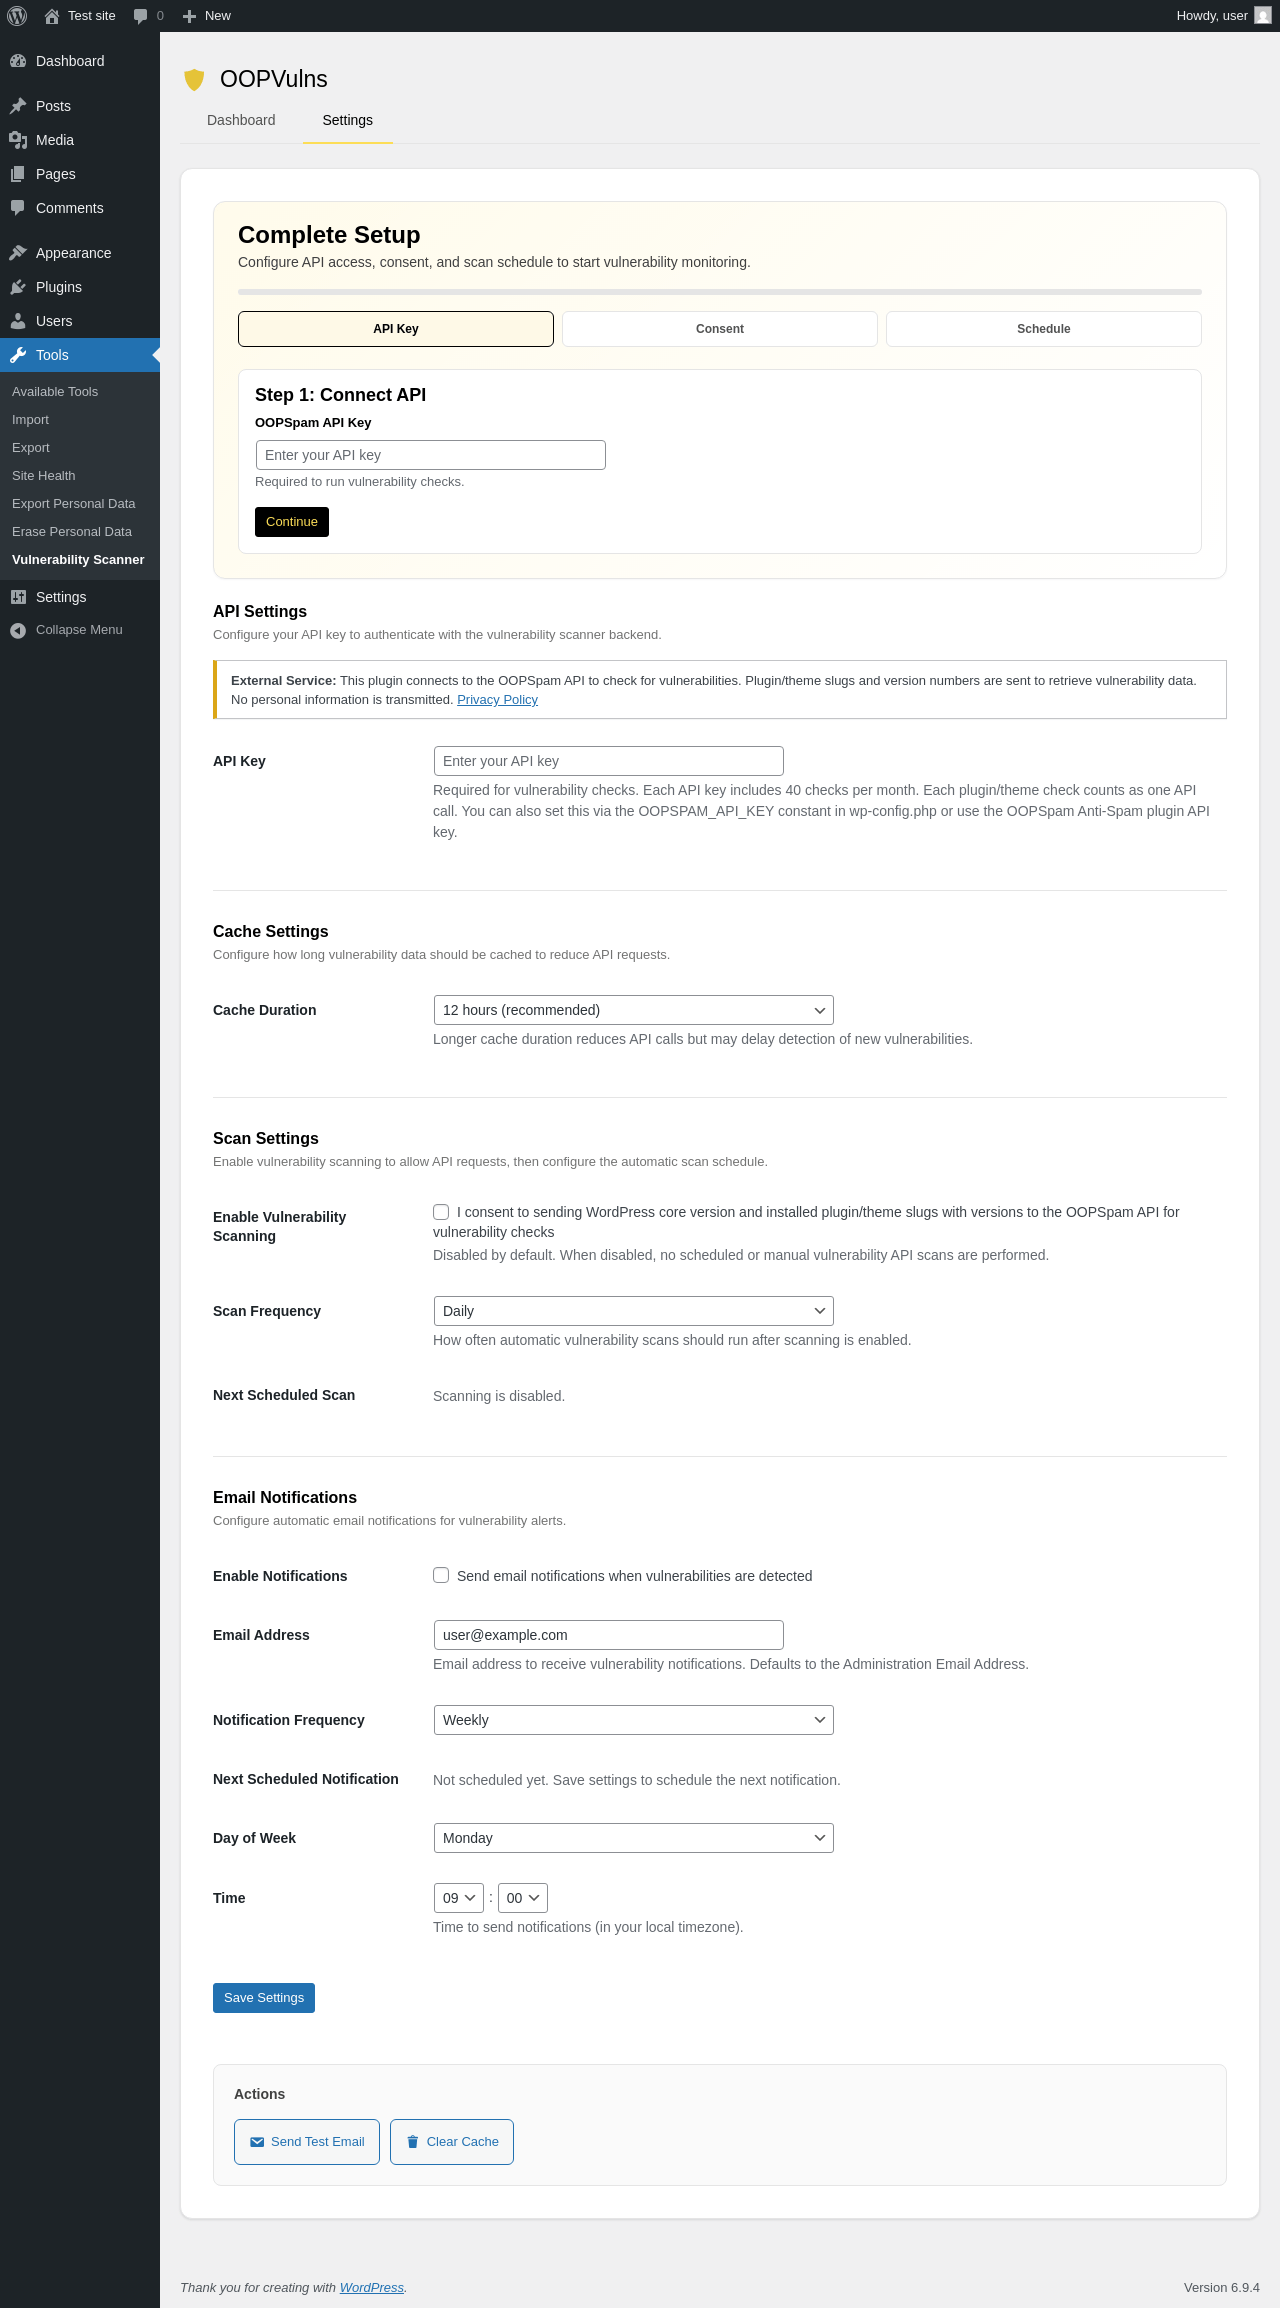
| URL | /wp-admin/tools.php?page=oopvulns-vulnerability-scanner&tab=settings |
|---|---|
| Aspect | menu-item-tab |
| HTTP status | 200 |
| Load time | 0.328 s |
| Memory usage | 3.75 MiB |
| JS errors | None |
| Resource errors | None |
Test site – Just another WordPress site
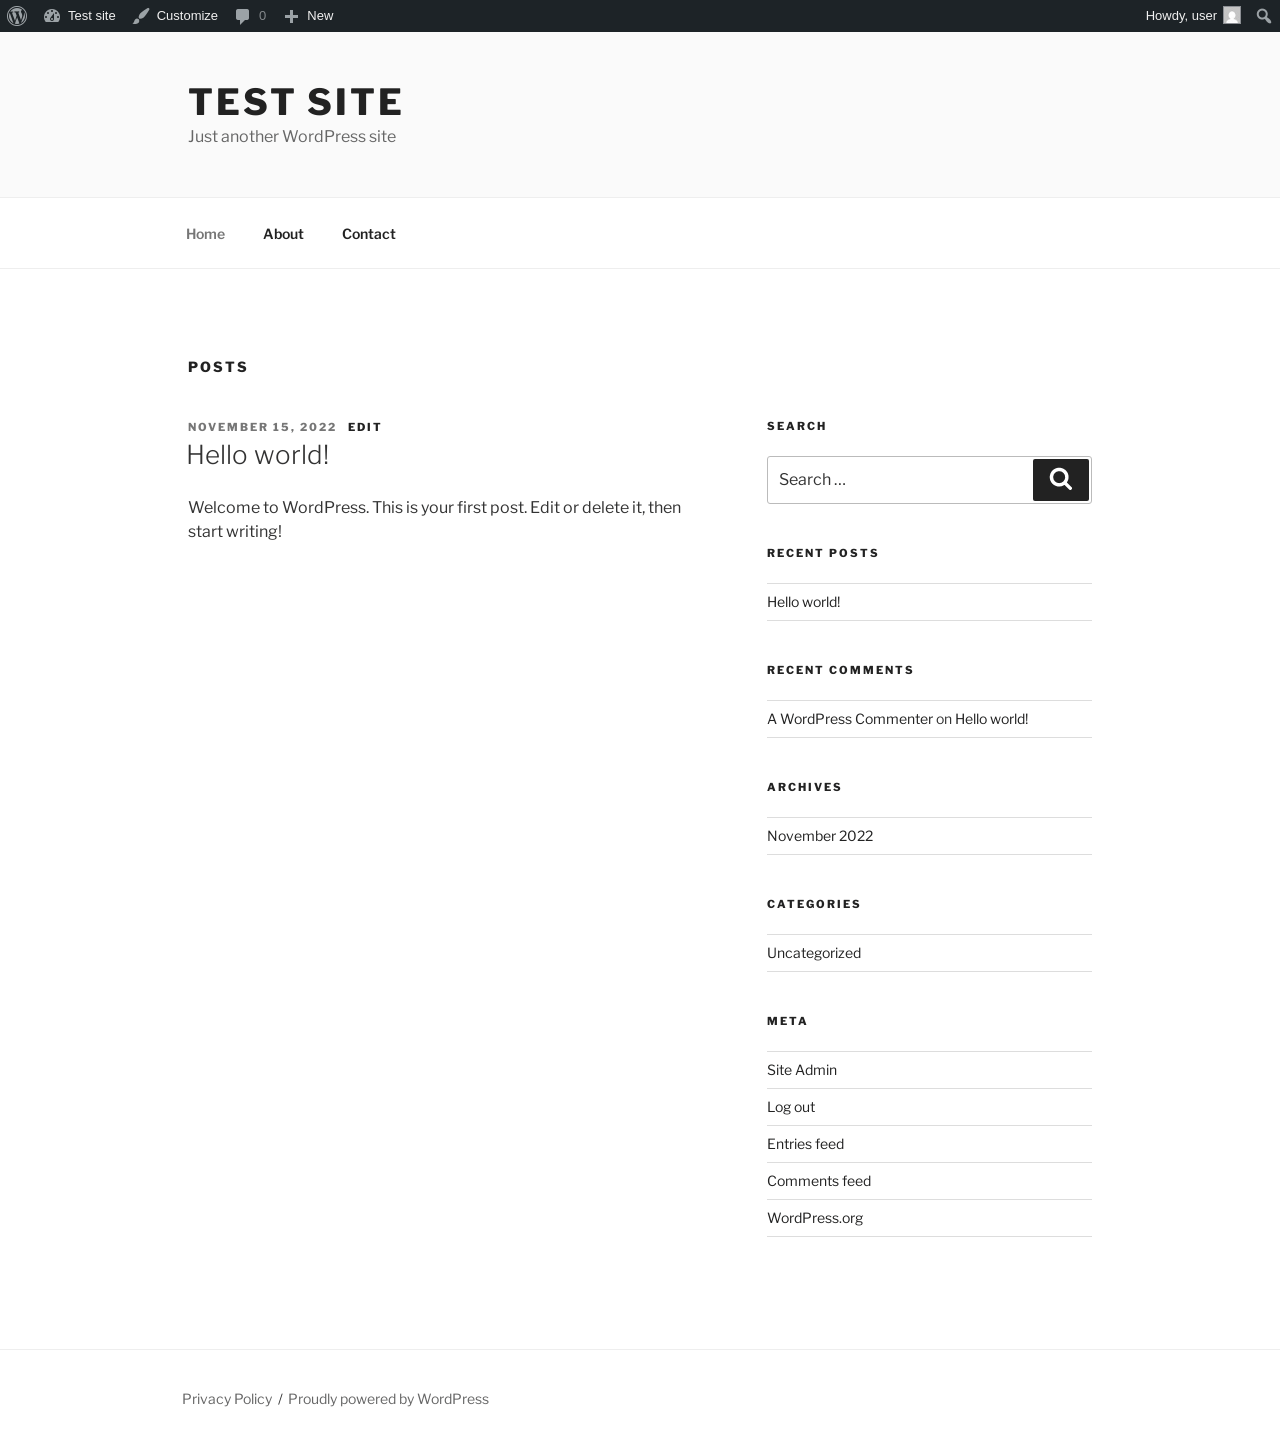
| URL | / |
|---|---|
| Aspect | front-page |
| HTTP status | 200 |
| Load time | 0.226 s |
| Memory usage | 4.14 MiB |
| JS errors | None |
| Resource errors | None |
Benchmark
| URL | Load time | Memory usage | ||||
|---|---|---|---|---|---|---|
| Inactive | Active | Change | Inactive | Active | Change | |
| /wp-admin/index.php | 0.485 s | 0.870 s | +0.385 s | 3.78 MiB | 3.81 MiB | + 38.88 KiB |
| /wp-admin/edit.php | 0.339 s | 0.473 s | +0.134 s | 3.78 MiB | 3.82 MiB | + 38.88 KiB |
| /wp-admin/post-new.php | 0.826 s | 0.863 s | +0.037 s | 6.31 MiB | 6.35 MiB | + 42.52 KiB |
| /wp-admin/upload.php | 0.599 s | 0.428 s | -0.171 s | 3.74 MiB | 3.76 MiB | + 21.48 KiB |
| /wp-admin/options-writing.php | 0.311 s | 0.291 s | -0.020 s | 3.71 MiB | 3.74 MiB | + 25.47 KiB |
| /wp-admin/media-new.php | 0.518 s | 0.270 s | -0.248 s | 3.7 MiB | 3.74 MiB | + 33.66 KiB |
| /wp-admin/edit-tags.php?taxonomy=category | 0.302 s | 0.415 s | +0.113 s | 3.72 MiB | 3.76 MiB | + 44.34 KiB |
| /wp-admin/post-new.php?post_type=page | 0.785 s | 0.915 s | +0.130 s | 6.3 MiB | 6.33 MiB | + 38.04 KiB |
| /wp-admin/options-discussion.php | 0.312 s | 0.441 s | +0.129 s | 3.71 MiB | 3.74 MiB | + 21.97 KiB |
| /wp-admin/edit-comments.php | 0.323 s | 0.313 s | -0.010 s | 3.73 MiB | 3.76 MiB | + 21.47 KiB |
| / | 0.247 s | 0.200 s | -0.047 s | 4.11 MiB | 4.14 MiB | + 31.15 KiB |
| Average | 0.459 s | 0.498 s | +0.039 s | 4.24 MiB | 4.27 MiB | + 32.53 KiB |
Code Statistics
Note: Third-party libraries and minified JS/CSS files are excluded from these statistics where possible, so the numbers you see here may be lower than those reported by other tools.
| Language | % | Lines of code | Comment lines | Files | |
|---|---|---|---|---|---|
| PHP | 67.7% | 3,249 | 694 | 8 | |
| CSS | 23.5% | 1,130 | 65 | 1 | |
| JavaScript | 8.8% | 420 | 94 | 1 | |
| Total | 4,799 | 853 | 10 | ||
PHP Code Analysis | More results »
| Lines of code | 3,291 |
|---|---|
| Total complexity | 441 |
| Median class complexity | 35.0 |
| Median method complexity | 3.5 |
| Most complex class | Admin |
| Most complex function | Admin::render_settings_tab() |
| Classes | 6 |
|---|---|
| Methods | 84 |
| Functions | 1 |
Additions
Things that the plugin adds to the site. This section is not intended to be comprehensive. The test tool only looks for a few specific types of added content.
Options wp_options 1
- oopvulns_settings
PHP Error Log
The log file is empty.