Opti-Behavior 1.0.5
Does Opti-Behavior work with WordPress 6.8.3 and PHP 8.1.12? A smoke test was performed on .
Summary
| No PHP errors, warnings or notices | |
| No JavaScript exceptions | |
| All test pages loaded successfully | |
| No resource errors | |
| Looks good! No problems were detected. |
Memory usage: 123.54 KiB
The average PHP memory usage increased by this amount after activating by the plugin.
Page speed impact:
insignificant.
The plugin didn't make the site noticeably slower.
| WordPress version | 6.8.3 |
|---|---|
| PHP version | 8.1.12 |
| MySQL version | 10.6.10 |
| PHP memory limit | 512M |
| Last updated | |
|---|---|
| Active installs | 500+ |
| WordPress.org page | https://wordpress.org/plugins/opti-behavior/ |
| Badges |
|
Pages 9
Plugins ‹ Test site — WordPress
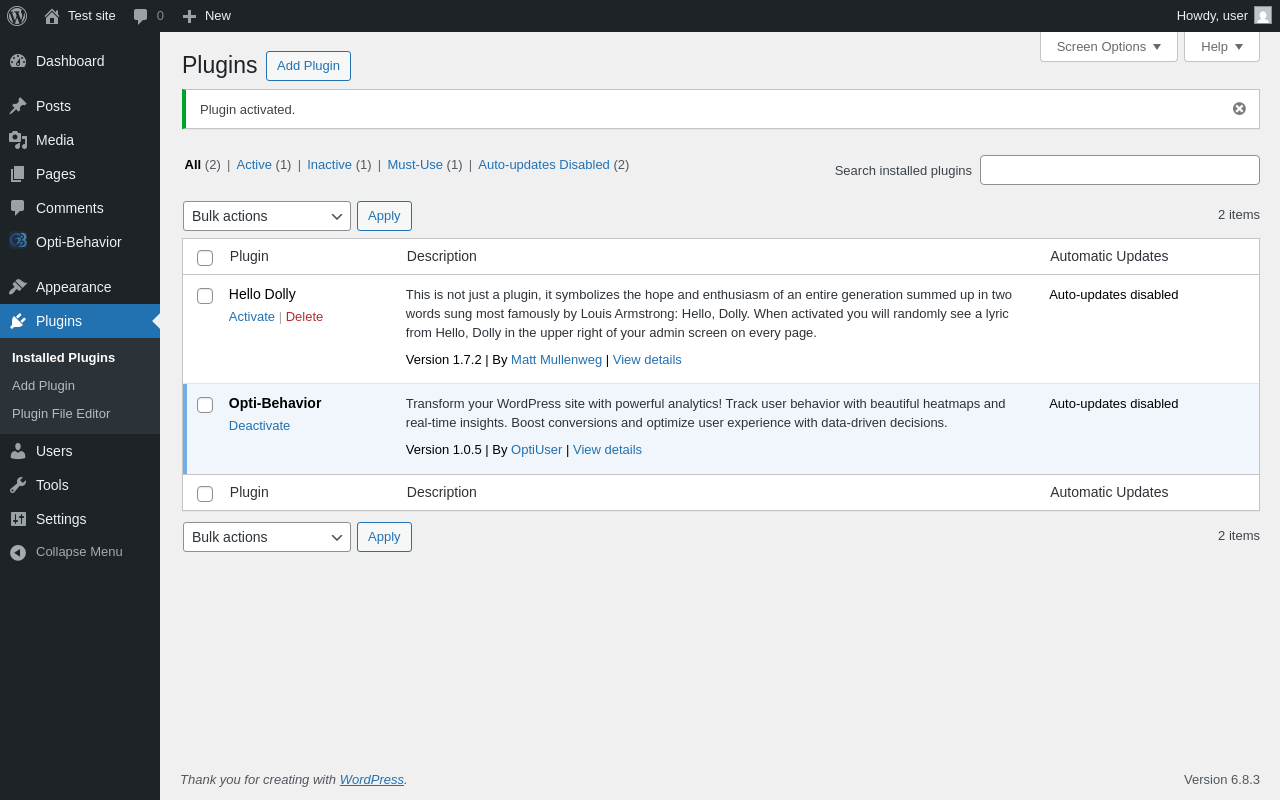
| URL | /wp-admin/plugins.php?plugin_status=all&paged=1&s |
|---|---|
| Requested URL | /wp-admin/plugins.php?action=activate&plugin=opti-behavior%2FOpti-Behavior.php&plugin_status=all&paged=1&s&_wpnonce=b1fbc60d77 |
| Aspect | after-activation |
| HTTP status | 200 |
| Load time | 1.173 s |
| Memory usage | 3.66 MiB |
| JS errors | None |
| Resource errors | None |
Opti-Behavior
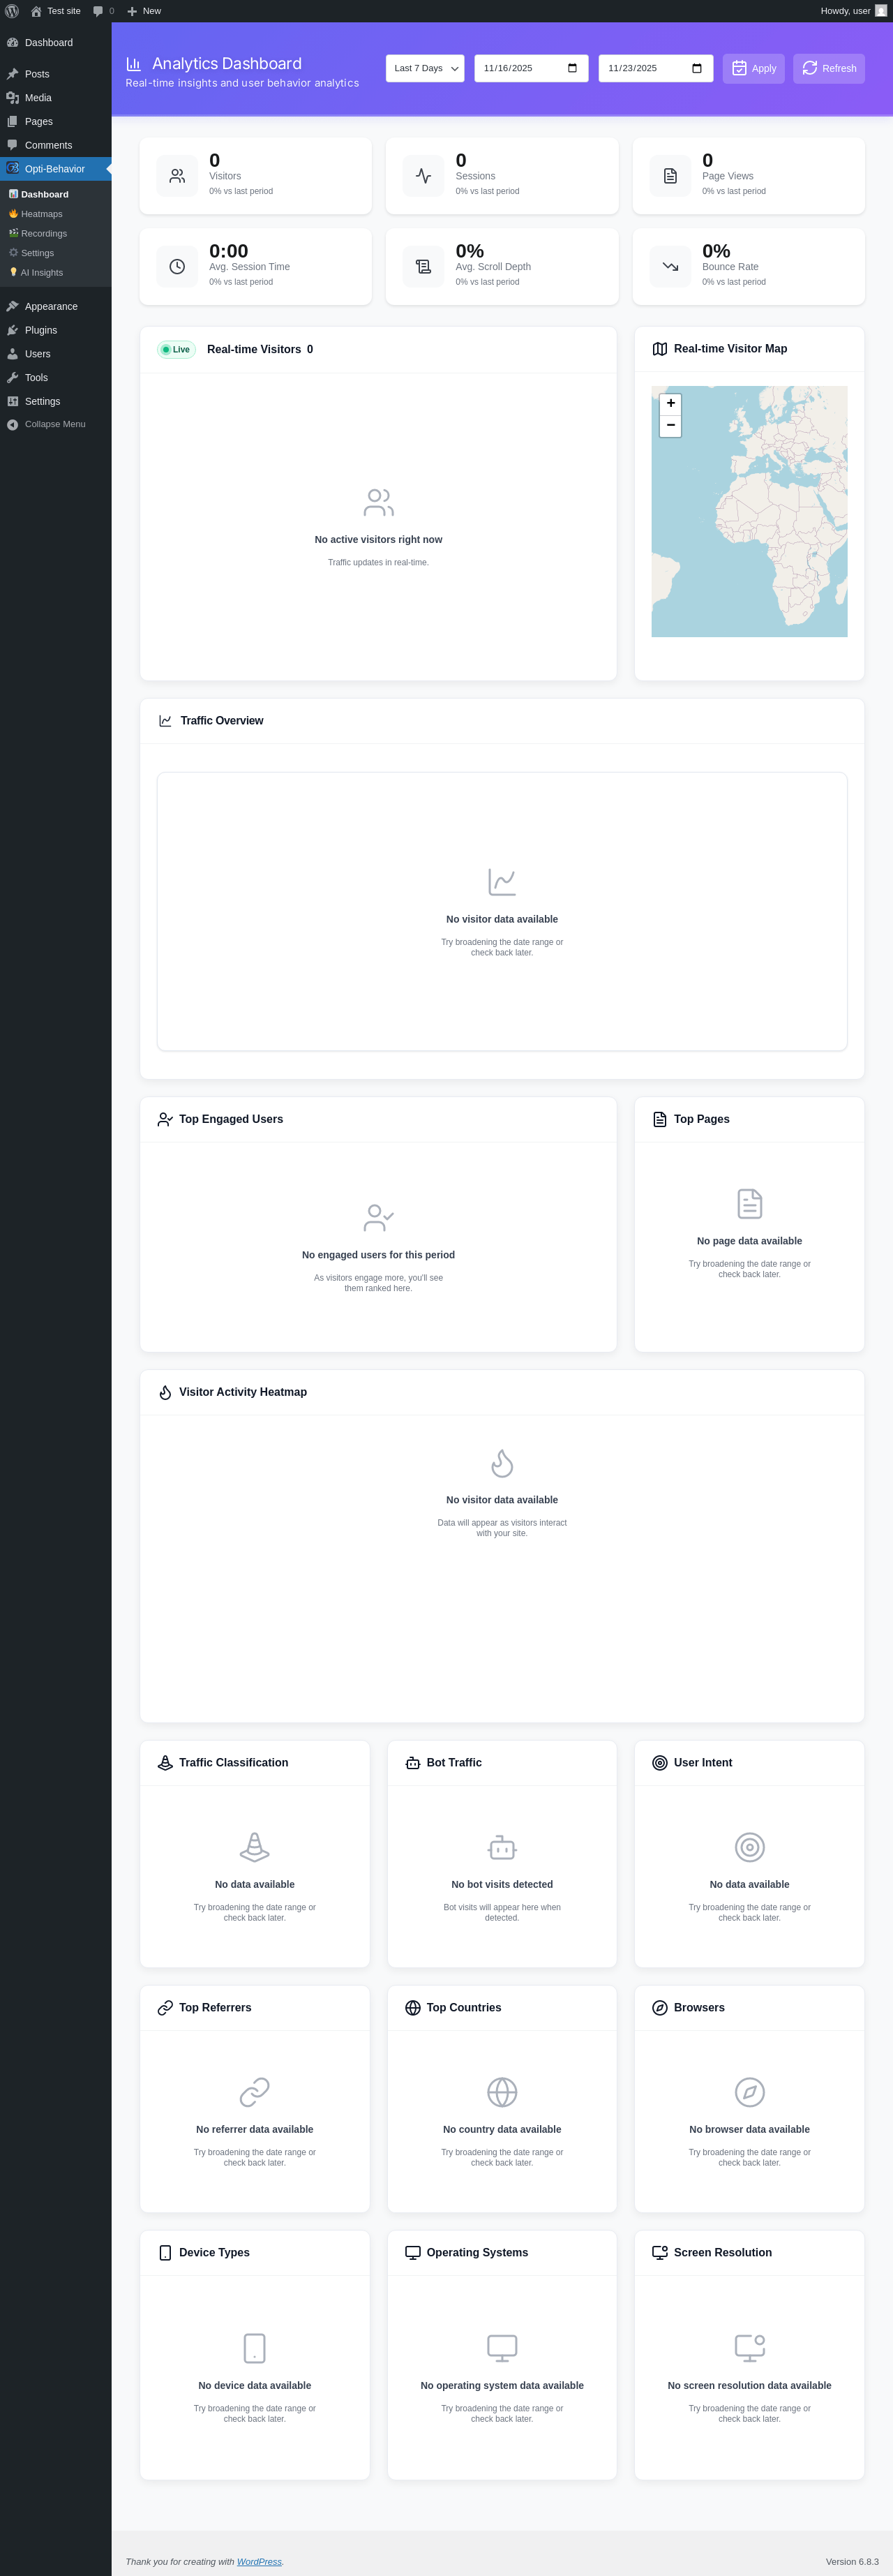
| URL | /wp-admin/admin.php?page=opti-behavior-analytics |
|---|---|
| Aspect | menu-item |
| HTTP status | 200 |
| Load time | 1.625 s |
| Memory usage | 3.63 MiB |
| JS errors | None |
| Resource errors | None |
Opti-Behavior → Heatmaps
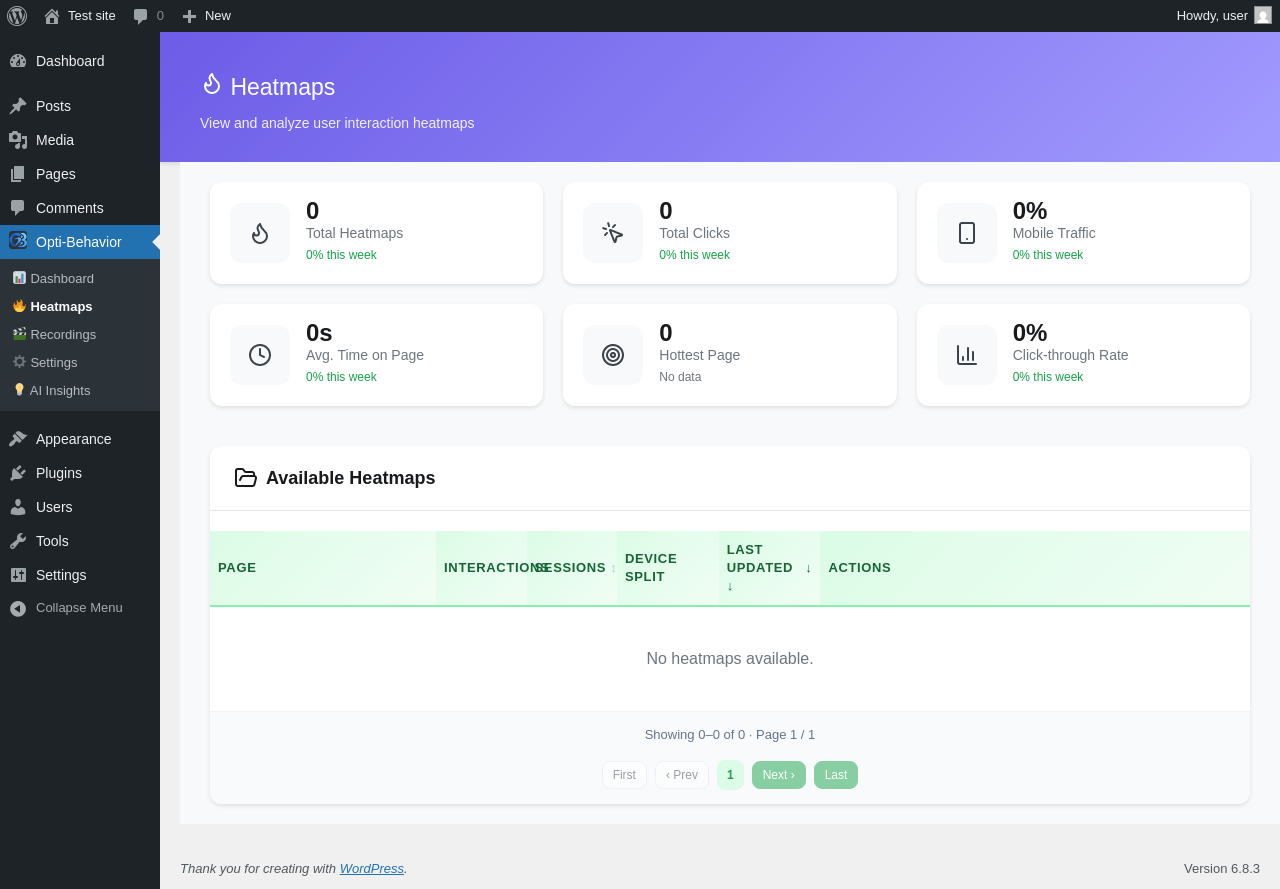
| URL | /wp-admin/admin.php?page=opti-behavior-heatmaps |
|---|---|
| Aspect | menu-item |
| HTTP status | 200 |
| Load time | 0.426 s |
| Memory usage | 3.63 MiB |
| JS errors | None |
| Resource errors | None |
Opti-Behavior → Recordings

| URL | /wp-admin/admin.php?page=opti-behavior-recordings |
|---|---|
| Aspect | menu-item |
| HTTP status | 200 |
| Load time | 0.341 s |
| Memory usage | 3.63 MiB |
| JS errors | None |
| Resource errors | None |
Opti-Behavior → Settings
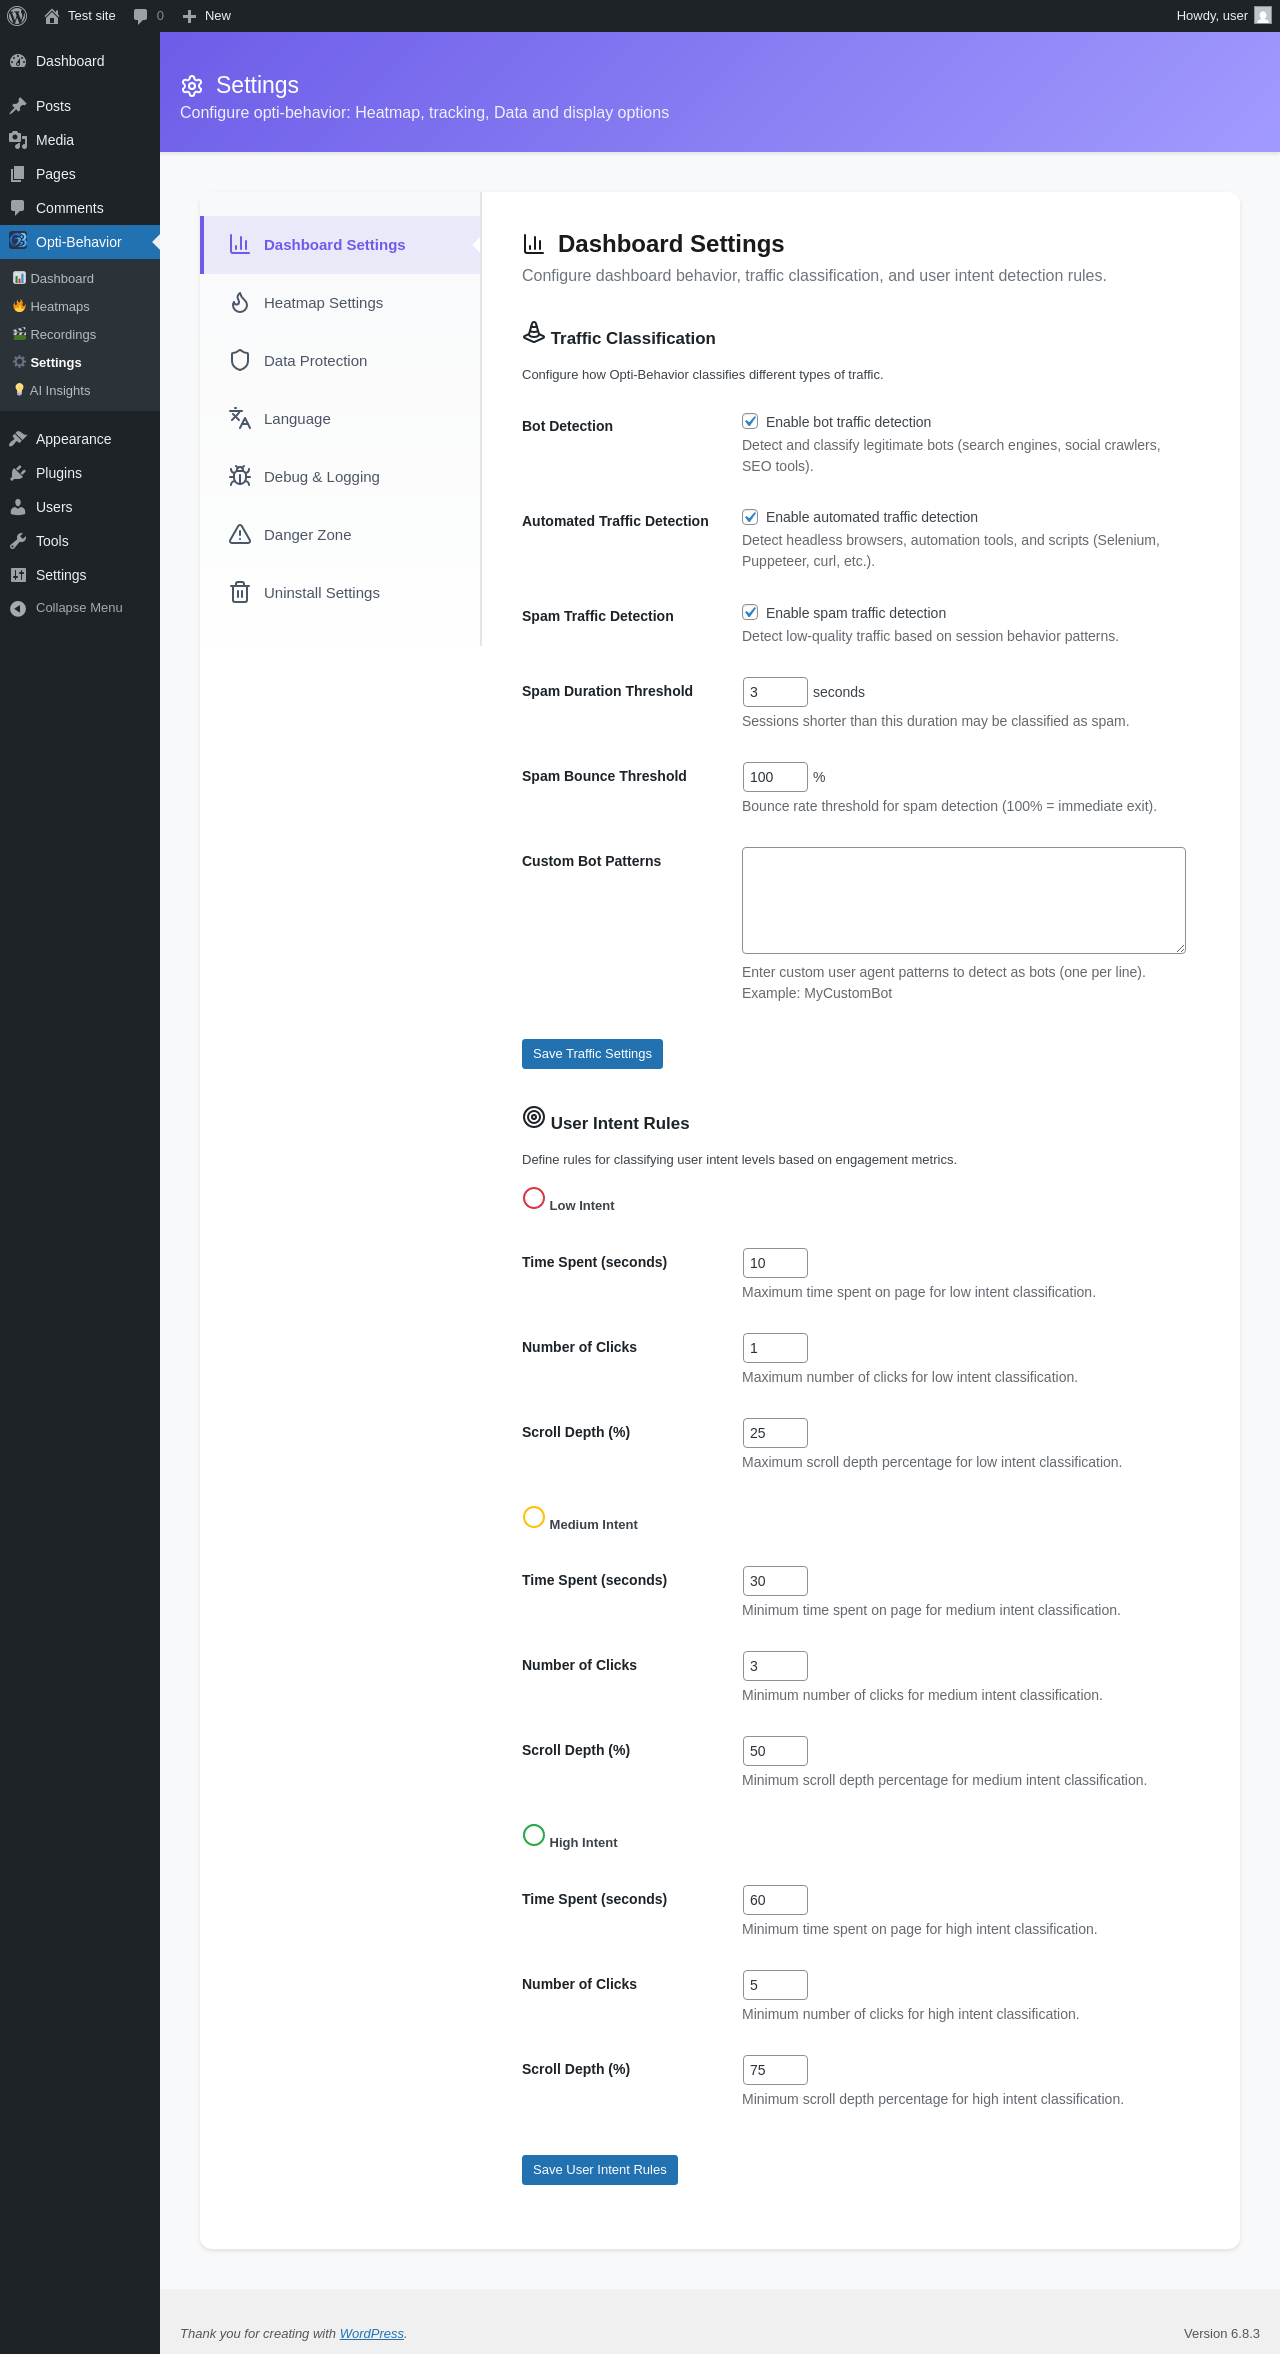
| URL | /wp-admin/admin.php?page=opti-behavior-settings |
|---|---|
| Aspect | menu-item |
| HTTP status | 200 |
| Load time | 0.355 s |
| Memory usage | 3.63 MiB |
| JS errors | None |
| Resource errors | None |
Opti-Behavior → AI Insights

| URL | /wp-admin/admin.php?page=opti-behavior-ai-insights |
|---|---|
| Aspect | menu-item |
| HTTP status | 200 |
| Load time | 0.624 s |
| Memory usage | 3.63 MiB |
| JS errors | None |
| Resource errors | None |
Test site – Just another WordPress site
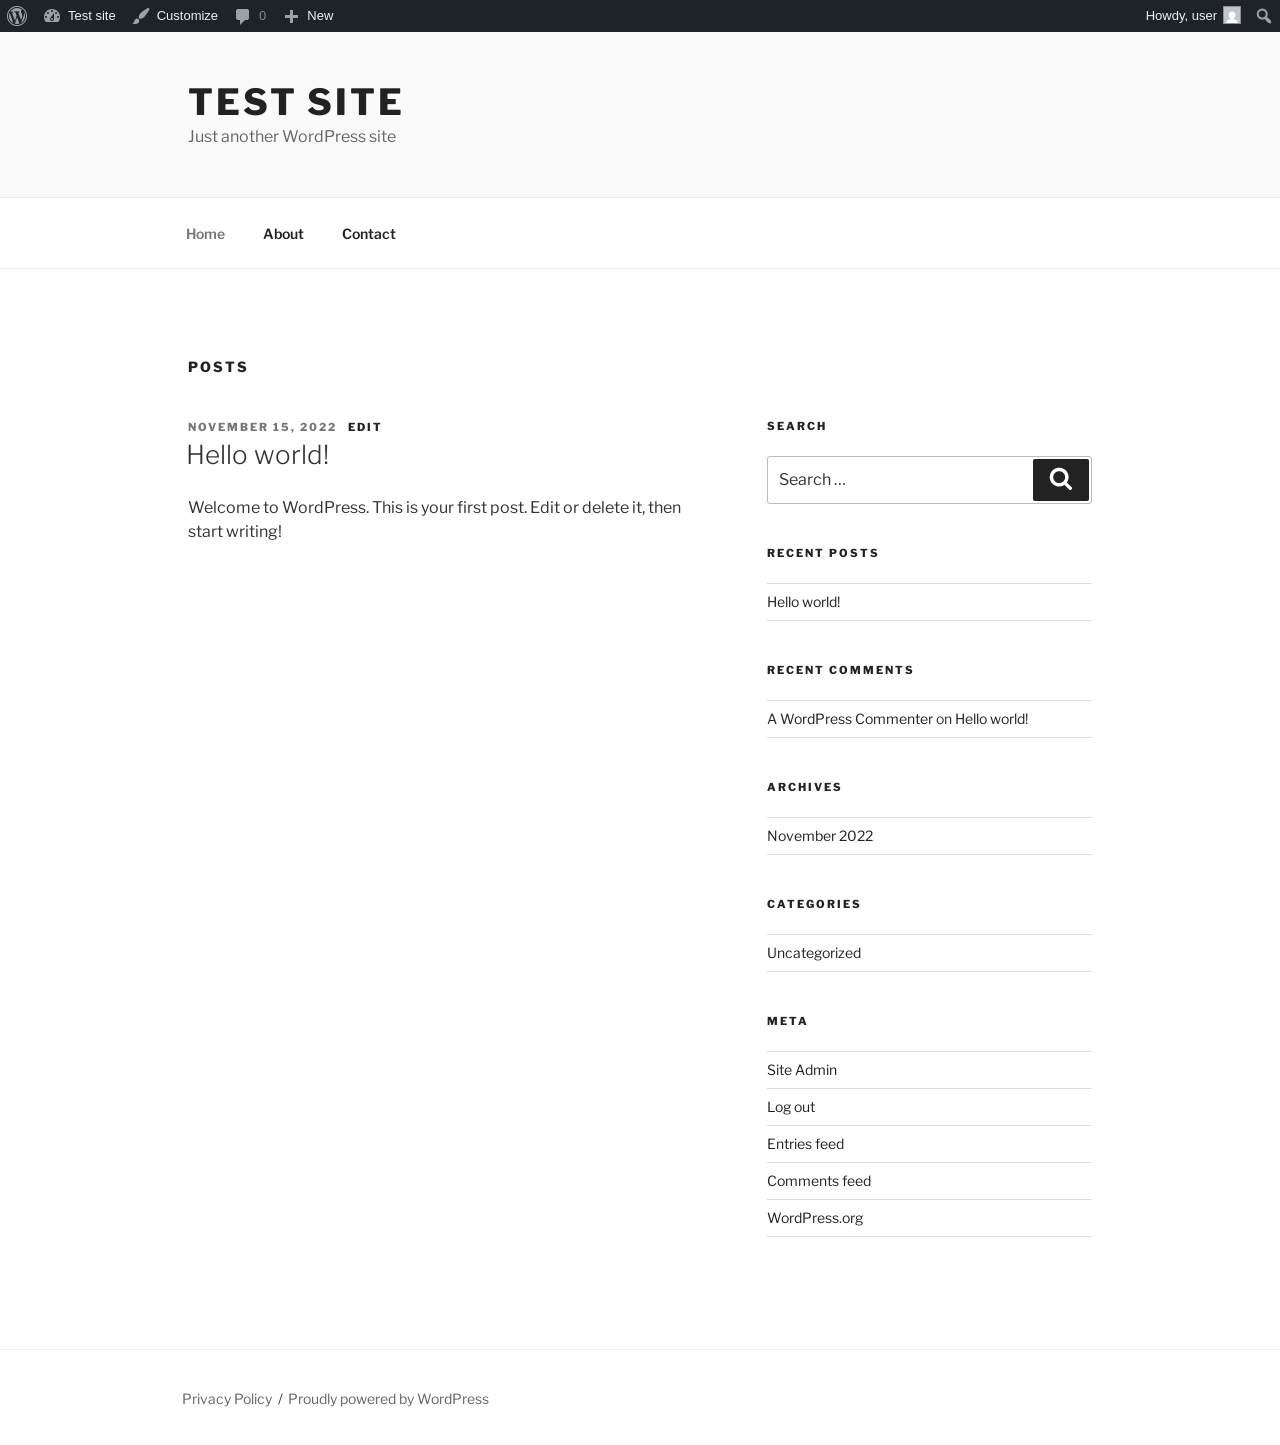
| URL | / |
|---|---|
| Aspect | front-page |
| HTTP status | 200 |
| Load time | 0.347 s |
| Memory usage | 3.48 MiB |
| JS errors | None |
| Resource errors | None |
Add Post ‹ Test site — WordPress
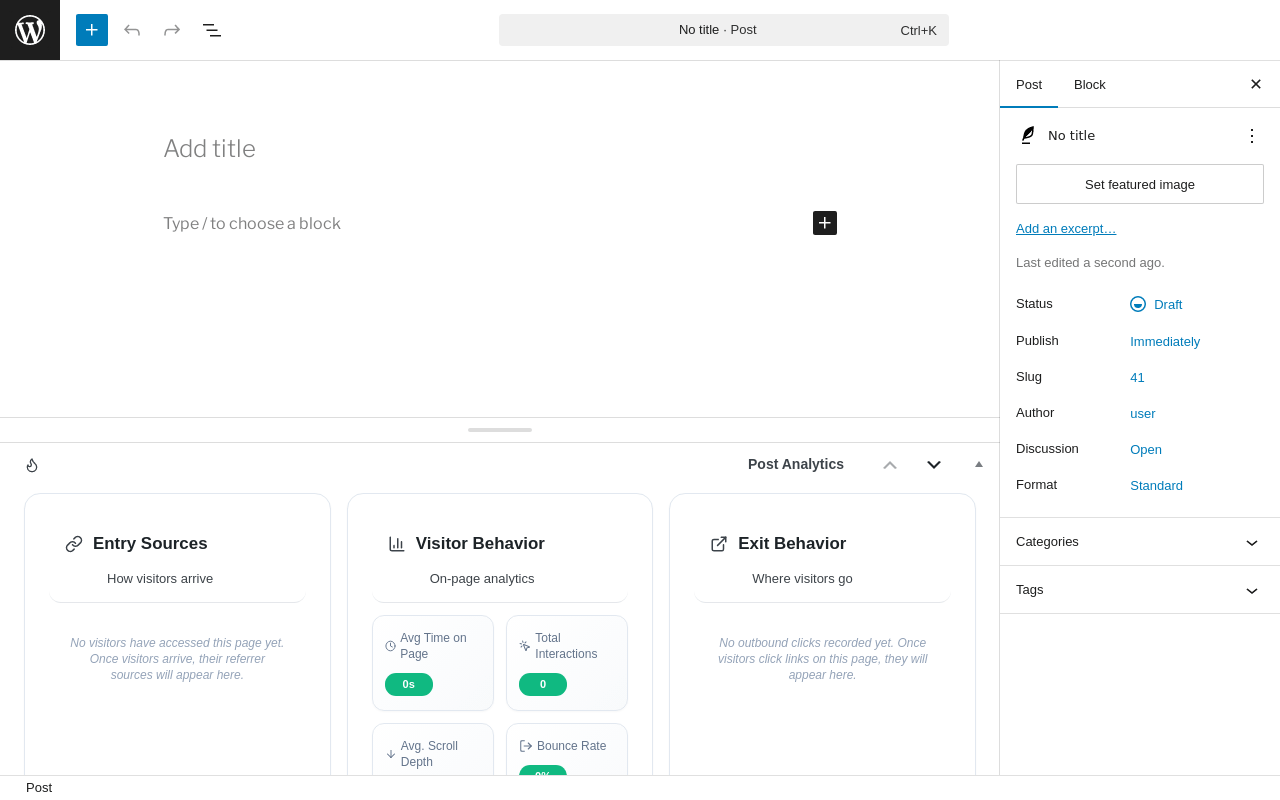
| URL | /wp-admin/post-new.php |
|---|---|
| Aspect | new-meta-boxes |
| HTTP status | 200 |
| Load time | 0.732 s |
| Memory usage | 6.2 MiB |
| JS errors | None |
| Resource errors | None |
Add Page ‹ Test site — WordPress
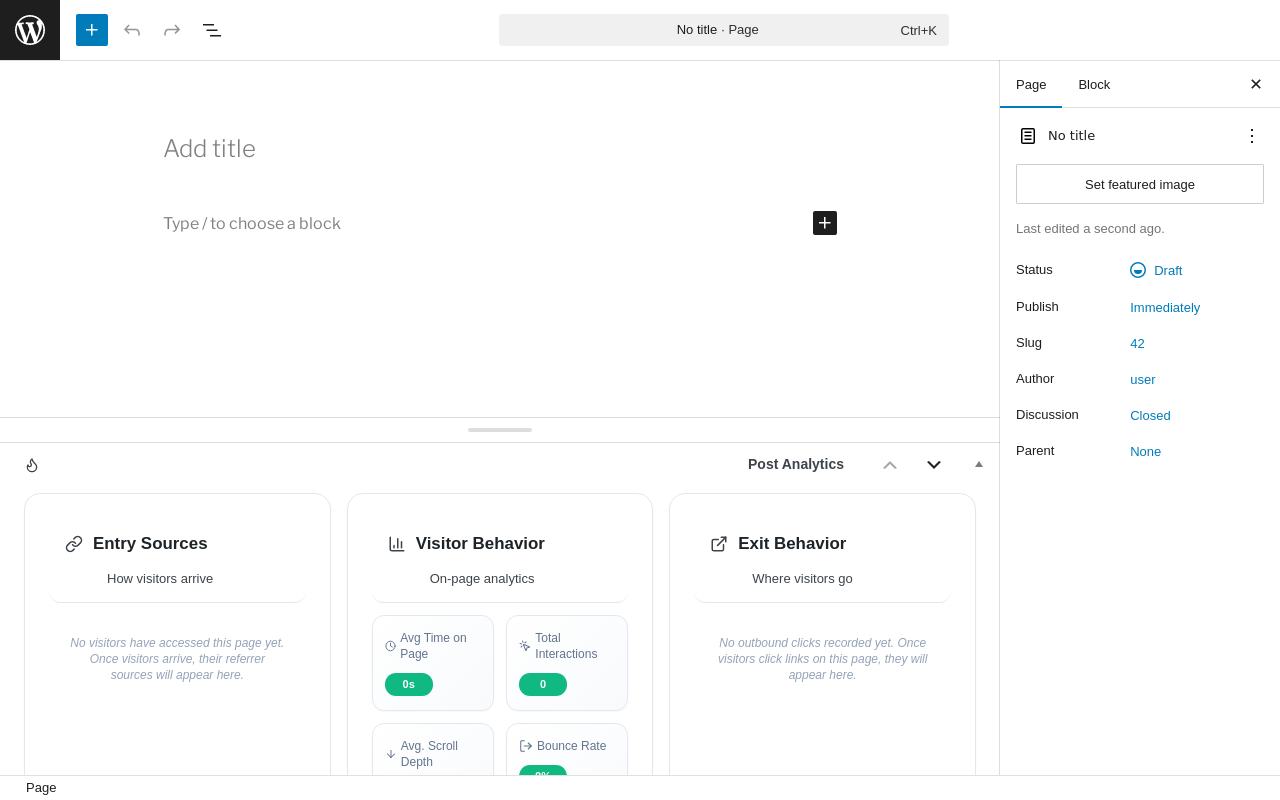
| URL | /wp-admin/post-new.php?post_type=page |
|---|---|
| Aspect | new-meta-boxes |
| HTTP status | 200 |
| Load time | 0.898 s |
| Memory usage | 6.18 MiB |
| JS errors | None |
| Resource errors | None |
Benchmark
| URL | Load time | Memory usage | ||||
|---|---|---|---|---|---|---|
| Inactive | Active | Change | Inactive | Active | Change | |
| /wp-admin/index.php | 0.375 s | 0.497 s | +0.122 s | 3.51 MiB | 3.64 MiB | + 137.48 KiB |
| /wp-admin/edit.php | 0.232 s | 0.235 s | +0.003 s | 3.57 MiB | 3.71 MiB | + 137.39 KiB |
| /wp-admin/post-new.php | 0.998 s | 1.164 s | +0.166 s | 6.06 MiB | 6.2 MiB | + 140.41 KiB |
| /wp-admin/upload.php | 0.629 s | 0.568 s | -0.061 s | 3.52 MiB | 3.64 MiB | + 119.98 KiB |
| /wp-admin/options-writing.php | 0.253 s | 0.210 s | -0.043 s | 3.5 MiB | 3.62 MiB | + 123.98 KiB |
| /wp-admin/media-new.php | 0.305 s | 0.267 s | -0.038 s | 3.49 MiB | 3.62 MiB | + 132.17 KiB |
| /wp-admin/edit-tags.php?taxonomy=category | 0.201 s | 0.219 s | +0.018 s | 3.5 MiB | 3.64 MiB | + 142.84 KiB |
| /wp-admin/post-new.php?post_type=page | 0.671 s | 0.889 s | +0.218 s | 6.05 MiB | 6.18 MiB | + 135.94 KiB |
| /wp-admin/options-discussion.php | 0.472 s | 0.372 s | -0.100 s | 3.5 MiB | 3.62 MiB | + 120.48 KiB |
| /wp-admin/edit-comments.php | 0.267 s | 0.244 s | -0.023 s | 3.52 MiB | 3.64 MiB | + 119.98 KiB |
| / | 0.339 s | 0.232 s | -0.107 s | 3.44 MiB | 3.49 MiB | + 48.27 KiB |
| Average | 0.431 s | 0.445 s | +0.014 s | 3.97 MiB | 4.09 MiB | + 123.54 KiB |
Code Statistics
Note: Third-party libraries and minified JS/CSS files are excluded from these statistics where possible, so the numbers you see here may be lower than those reported by other tools.
| Language | % | Lines of code | Comment lines | Files | |
|---|---|---|---|---|---|
| PHP | 44.5% | 14,448 | 4,675 | 33 | |
| JavaScript | 27.8% | 9,016 | 958 | 16 | |
| CSS | 22.7% | 7,387 | 356 | 14 | |
| PO File | 4.7% | 1,521 | 855 | 1 | |
| Markdown | 0.3% | 99 | 0 | 1 | |
| Total | 32,471 | 6,844 | 65 | ||
PHP Code Analysis | More results »
| Lines of code | 14,562 |
|---|---|
| Total complexity | 2,454 |
| Median class complexity | 50.0 |
| Median method complexity | 2.0 |
| Most complex class | Opti_Behavior_Heatmap_Dashboard |
| Most complex function | Opti_Behavior_Heatmap_Ajax_Handler::handle_recorder_events() |
| Classes | 18 |
|---|---|
| Methods | 367 |
| Functions | 22 |
Additions
Things that the plugin adds to the site. This section is not intended to be comprehensive. The test tool only looks for a few specific types of added content.
Database Tables 10
- wp_optibehavior_bot_visits
- wp_optibehavior_events
- wp_optibehavior_outbound_clicks
- wp_optibehavior_pages
- wp_optibehavior_pageviews
- wp_optibehavior_recordings
- wp_optibehavior_referrers
- wp_optibehavior_session_pages
- wp_optibehavior_sessions
- wp_optibehavior_visitors
Options wp_options 6
- opti_behavior_db_version
- opti_behavior_heatmap_data_protection
- opti_behavior_heatmap_last_integrity_check
- opti_behavior_heatmap_option
- optibehavior_indexes_last_checked
- optibehavior_referrers_last_backfill
Meta Boxes
{
    "post": {
        "optibehavior_editor_analytics": {
            "title": "Post Analytics",
            "context": "normal"
        }
    },
    "page": {
        "optibehavior_editor_analytics": {
            "title": "Post Analytics",
            "context": "normal"
        }
    }
}
PHP Error Log
The log file is empty.