Opti-Behavior 1.0.7
Does Opti-Behavior work with WordPress 6.8.3 and PHP 8.1.12? A smoke test was performed on .
Summary
| No PHP errors, warnings or notices | |
| No JavaScript exceptions | |
| All test pages loaded successfully | |
| No resource errors | |
| Looks good! No problems were detected. |
Memory usage: 124.3 KiB
The average PHP memory usage increased by this amount after activating by the plugin.
Page speed impact:
0.108 seconds
The average page load time increased by this amount after activating the plugin.
| WordPress version | 6.8.3 |
|---|---|
| PHP version | 8.1.12 |
| MySQL version | 10.6.10 |
| PHP memory limit | 512M |
| Last updated | |
|---|---|
| Active installs | 500+ |
| WordPress.org page | https://wordpress.org/plugins/opti-behavior/ |
| Badges |
|
Pages 9
Plugins ‹ Test site — WordPress
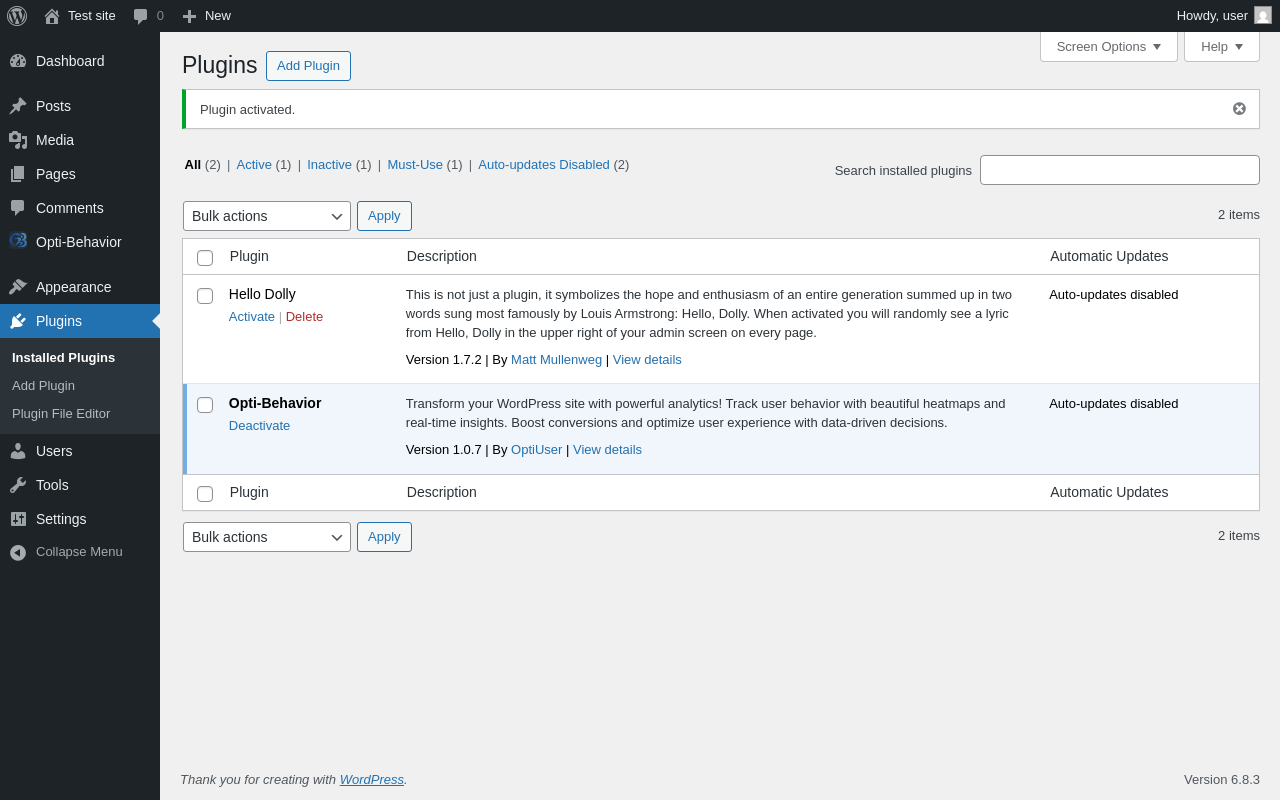
| URL | /wp-admin/plugins.php?plugin_status=all&paged=1&s |
|---|---|
| Requested URL | /wp-admin/plugins.php?action=activate&plugin=opti-behavior%2FOpti-Behavior.php&plugin_status=all&paged=1&s&_wpnonce=3921ee3e2a |
| Aspect | after-activation |
| HTTP status | 200 |
| Load time | 0.979 s |
| Memory usage | 3.66 MiB |
| JS errors | None |
| Resource errors | None |
Opti-Behavior
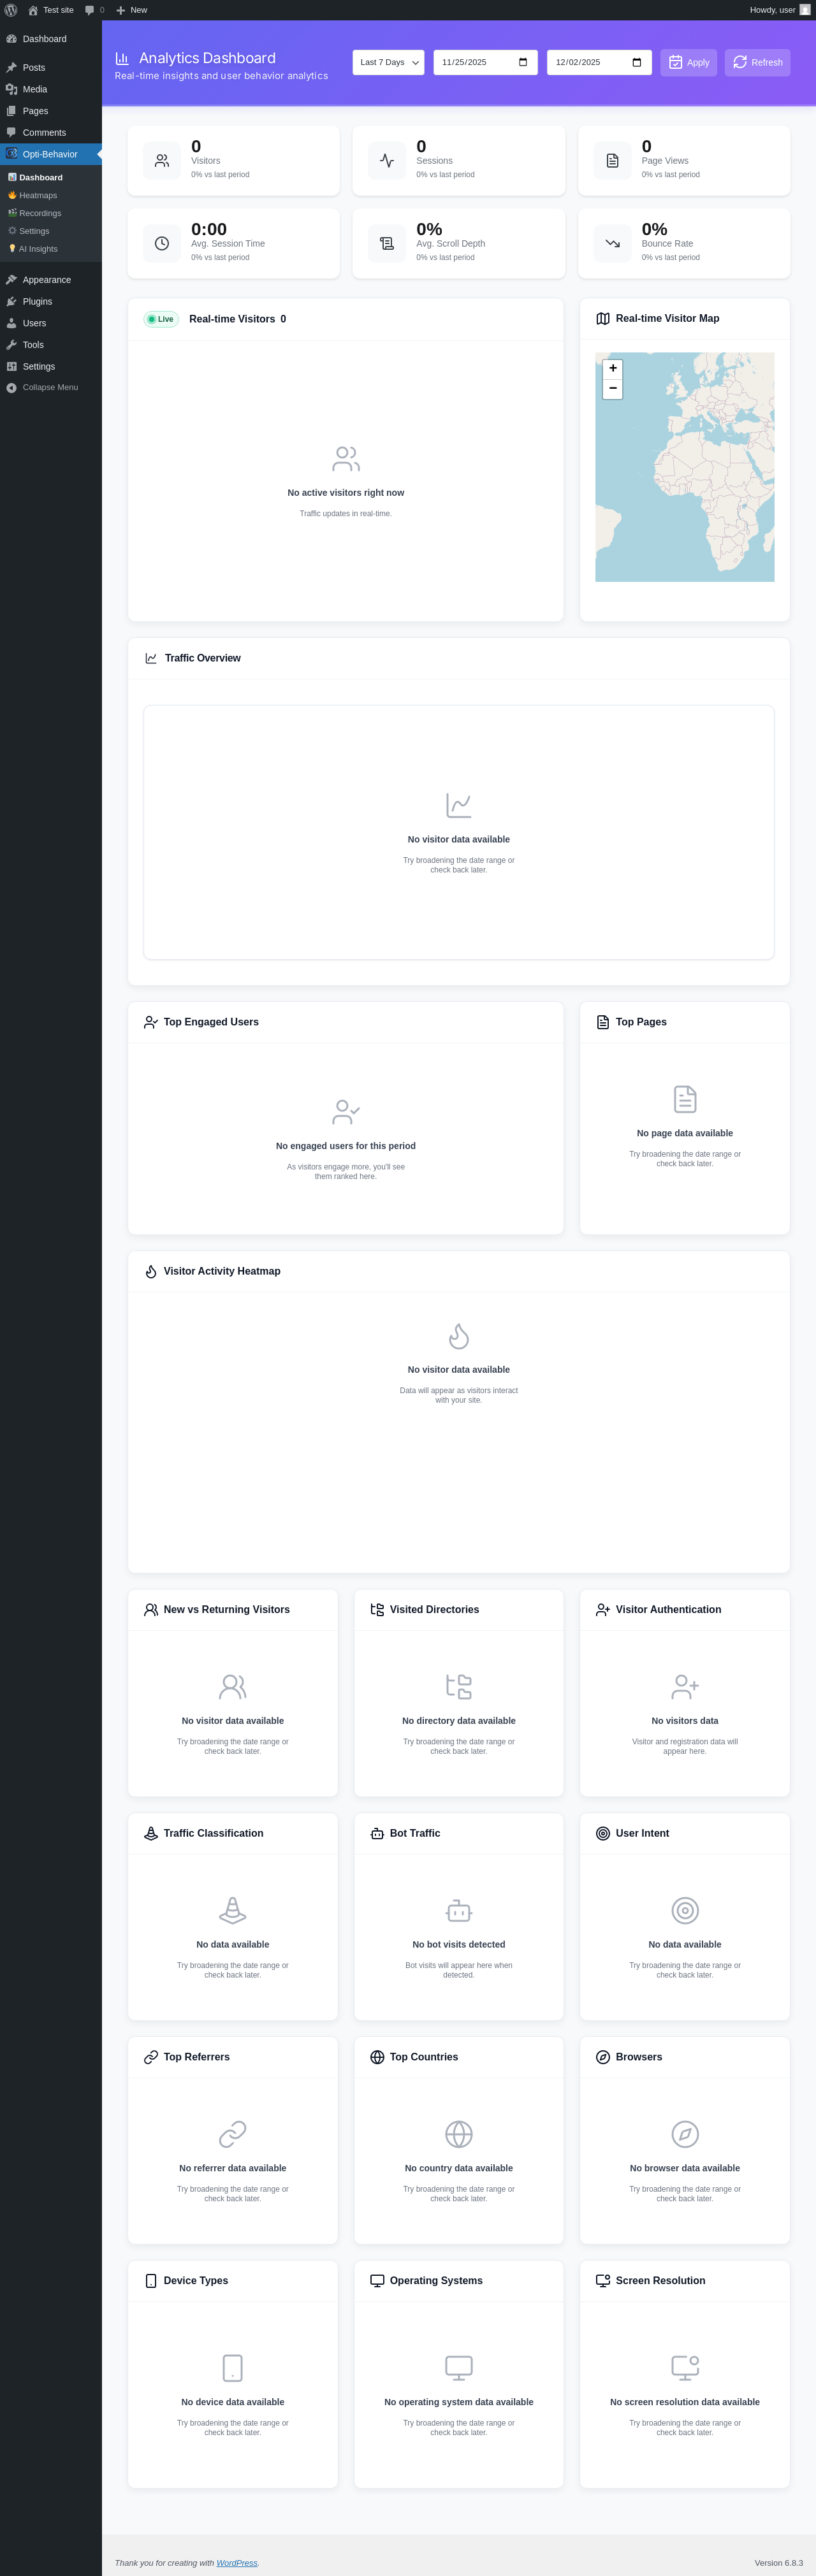
| URL | /wp-admin/admin.php?page=opti-behavior-analytics |
|---|---|
| Aspect | menu-item |
| HTTP status | 200 |
| Load time | 1.570 s |
| Memory usage | 3.64 MiB |
| JS errors | None |
| Resource errors | None |
Opti-Behavior → Heatmaps
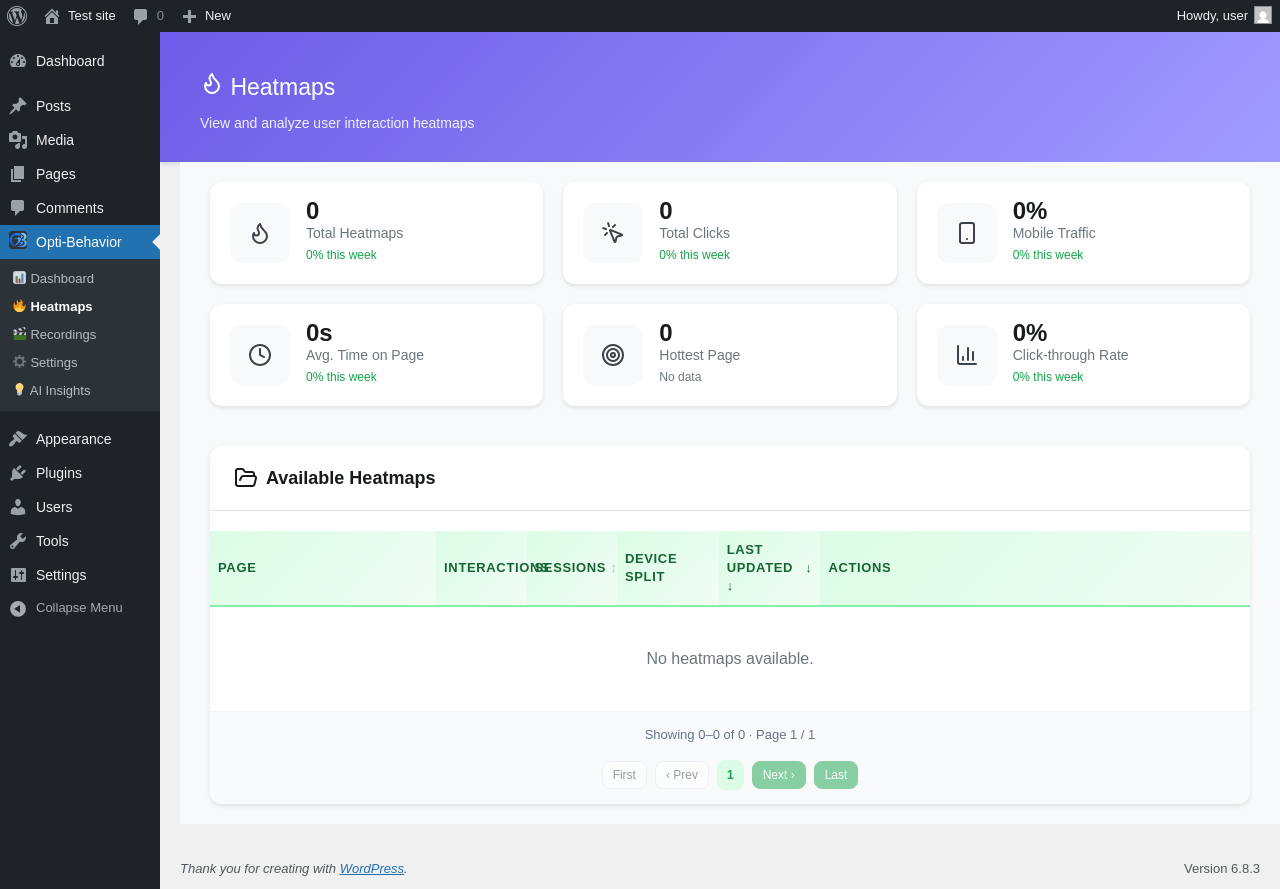
| URL | /wp-admin/admin.php?page=opti-behavior-heatmaps |
|---|---|
| Aspect | menu-item |
| HTTP status | 200 |
| Load time | 0.375 s |
| Memory usage | 3.64 MiB |
| JS errors | None |
| Resource errors | None |
Opti-Behavior → Recordings

| URL | /wp-admin/admin.php?page=opti-behavior-recordings |
|---|---|
| Aspect | menu-item |
| HTTP status | 200 |
| Load time | 0.290 s |
| Memory usage | 3.63 MiB |
| JS errors | None |
| Resource errors | None |
Opti-Behavior → Settings
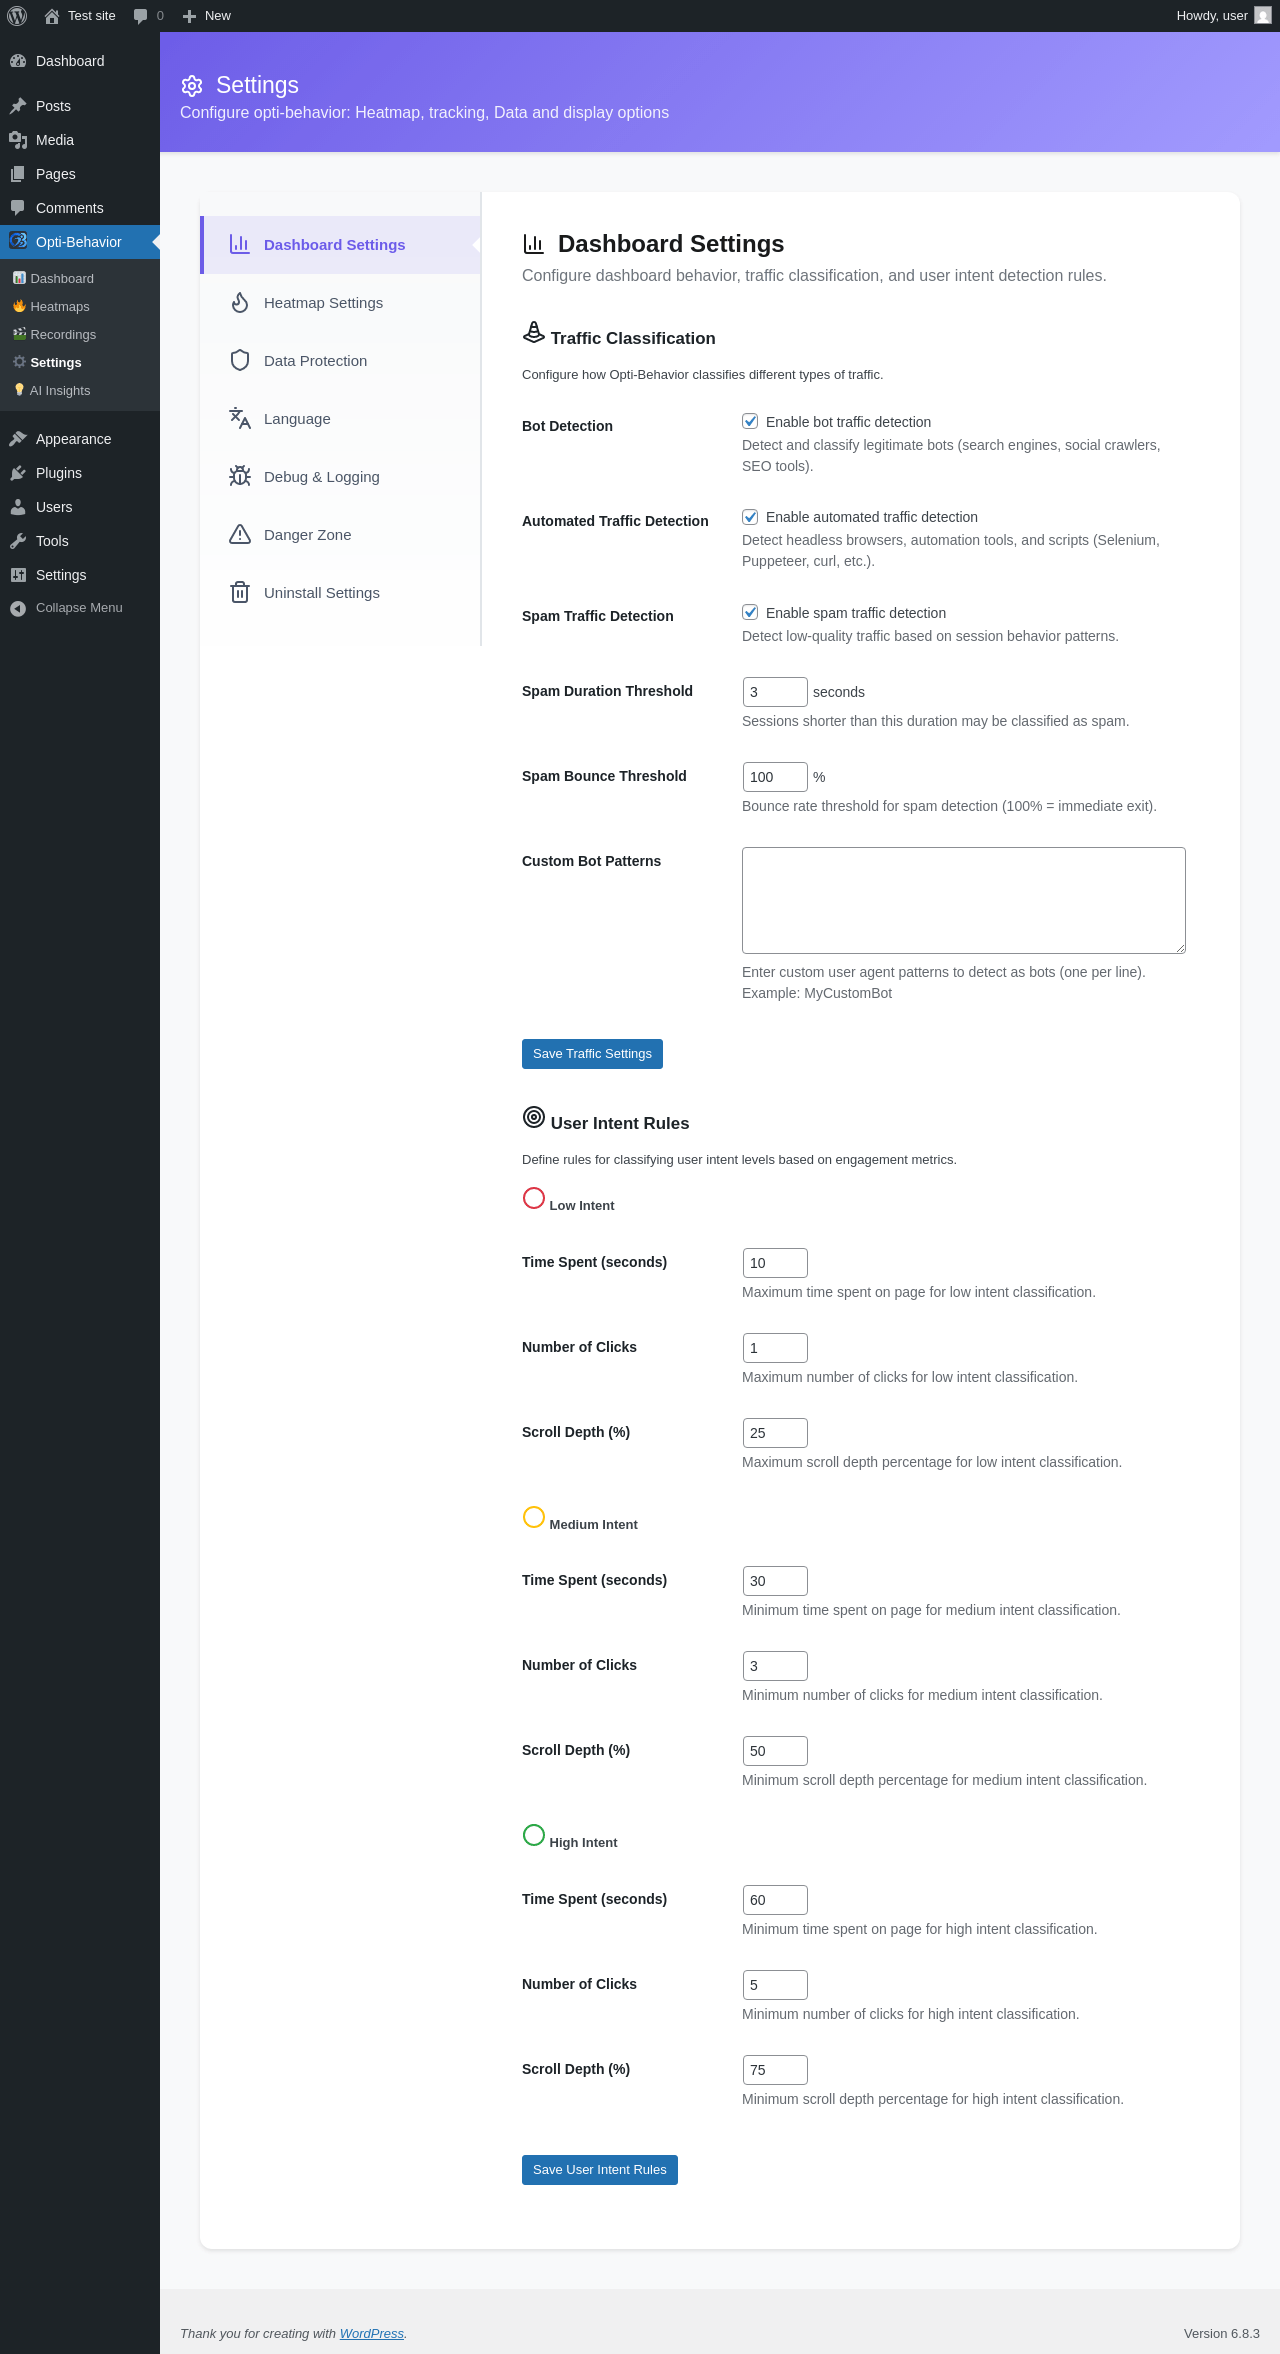
| URL | /wp-admin/admin.php?page=opti-behavior-settings |
|---|---|
| Aspect | menu-item |
| HTTP status | 200 |
| Load time | 0.306 s |
| Memory usage | 3.63 MiB |
| JS errors | None |
| Resource errors | None |
Opti-Behavior → AI Insights

| URL | /wp-admin/admin.php?page=opti-behavior-ai-insights |
|---|---|
| Aspect | menu-item |
| HTTP status | 200 |
| Load time | 0.676 s |
| Memory usage | 3.63 MiB |
| JS errors | None |
| Resource errors | None |
Test site – Just another WordPress site
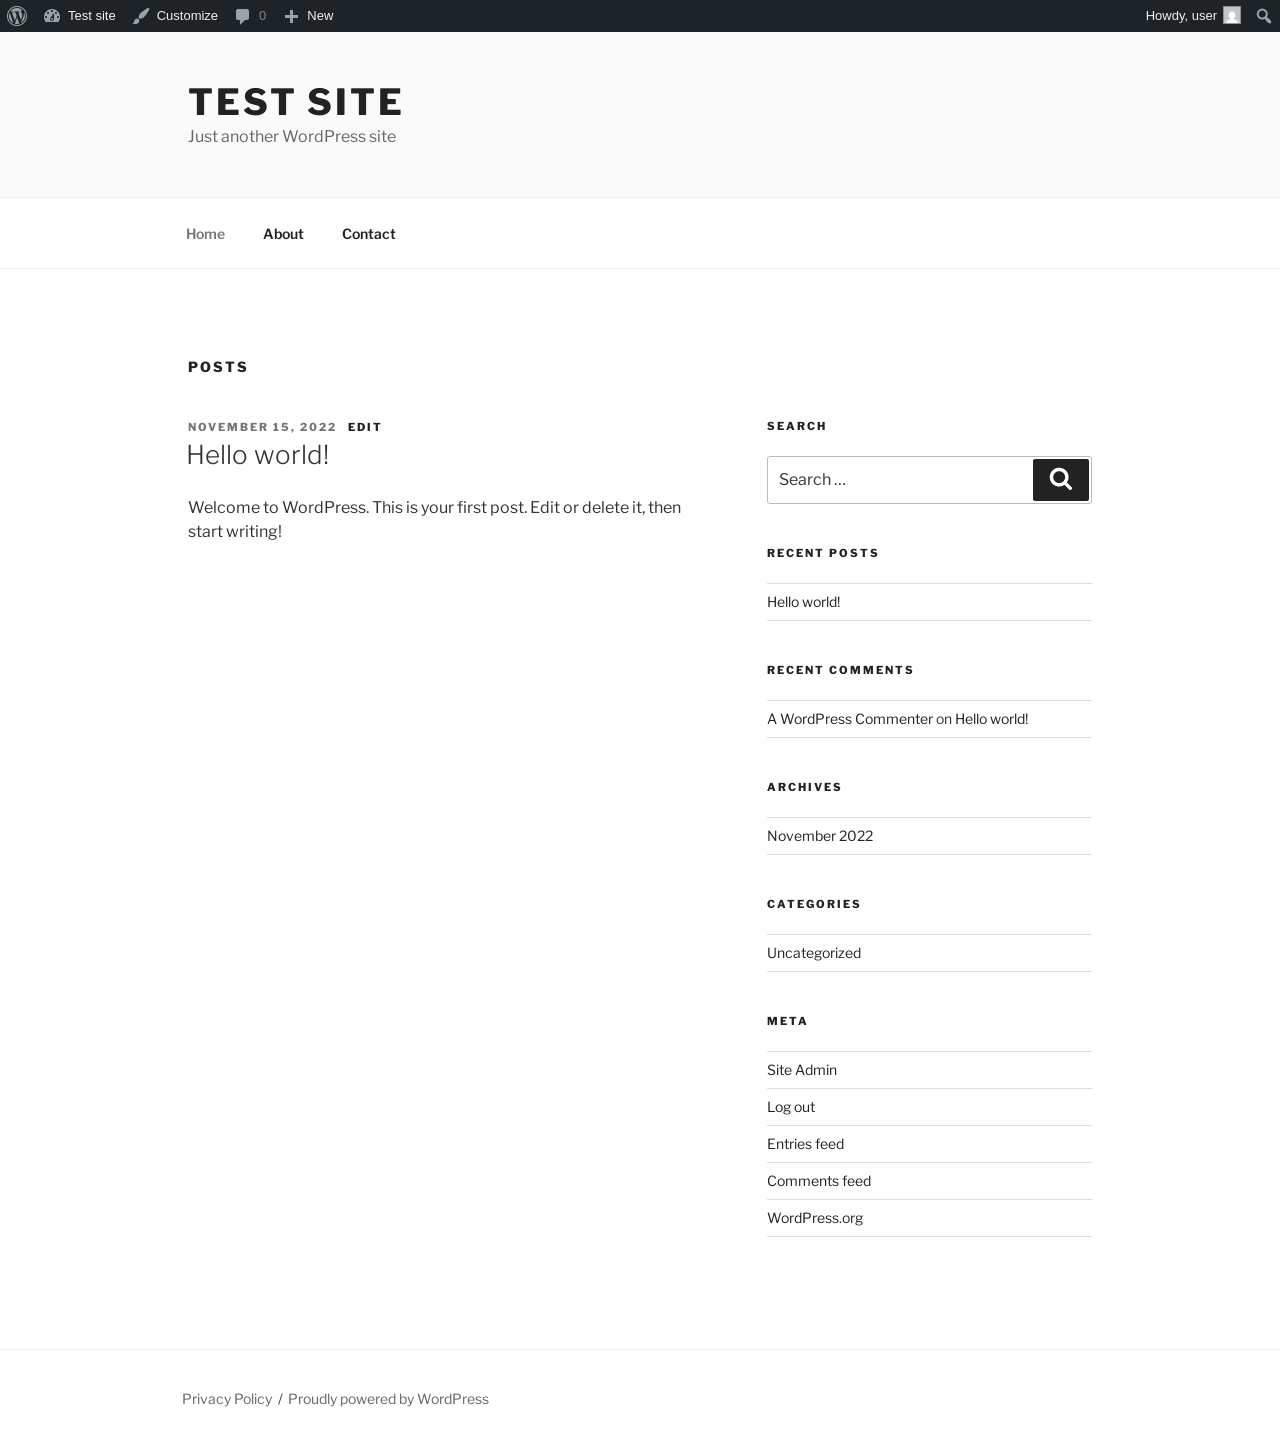
| URL | / |
|---|---|
| Aspect | front-page |
| HTTP status | 200 |
| Load time | 0.274 s |
| Memory usage | 3.49 MiB |
| JS errors | None |
| Resource errors | None |
Add Post ‹ Test site — WordPress
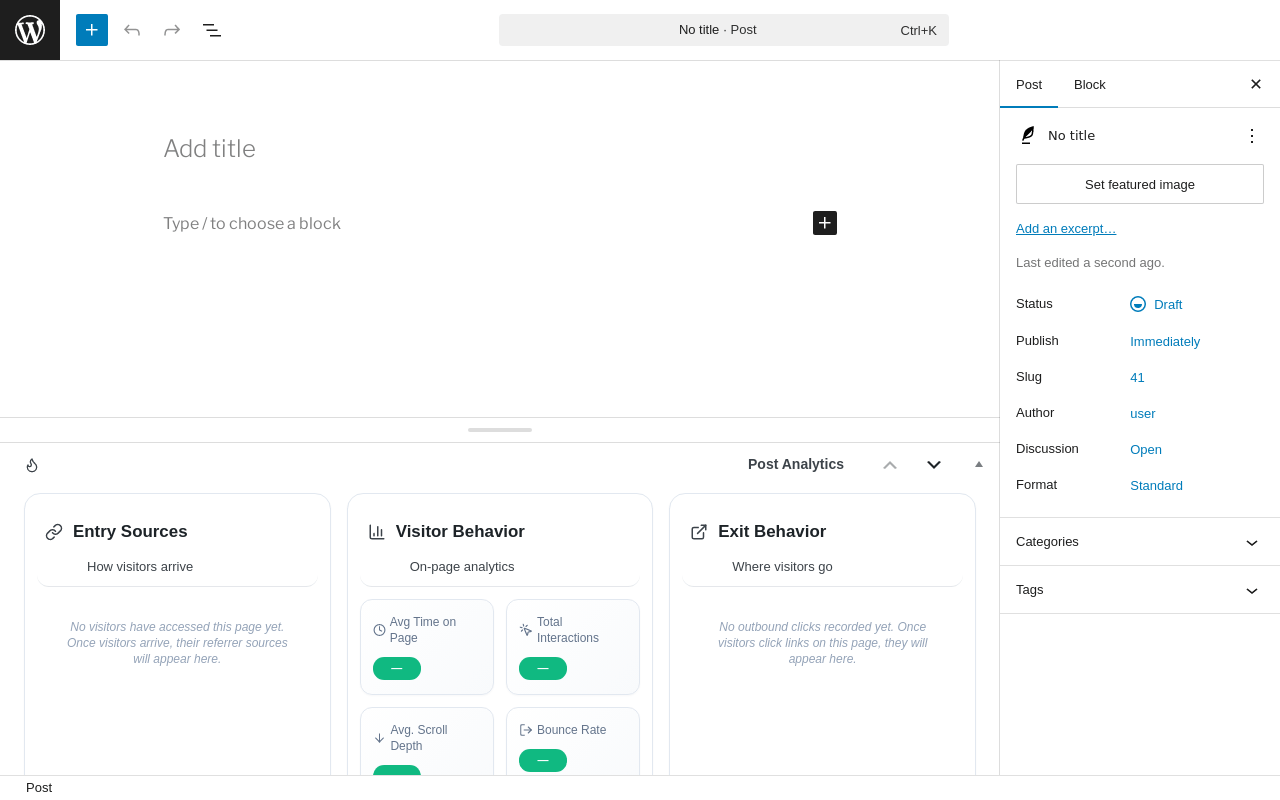
| URL | /wp-admin/post-new.php |
|---|---|
| Aspect | new-meta-boxes |
| HTTP status | 200 |
| Load time | 0.792 s |
| Memory usage | 6.2 MiB |
| JS errors | None |
| Resource errors | None |
Add Page ‹ Test site — WordPress
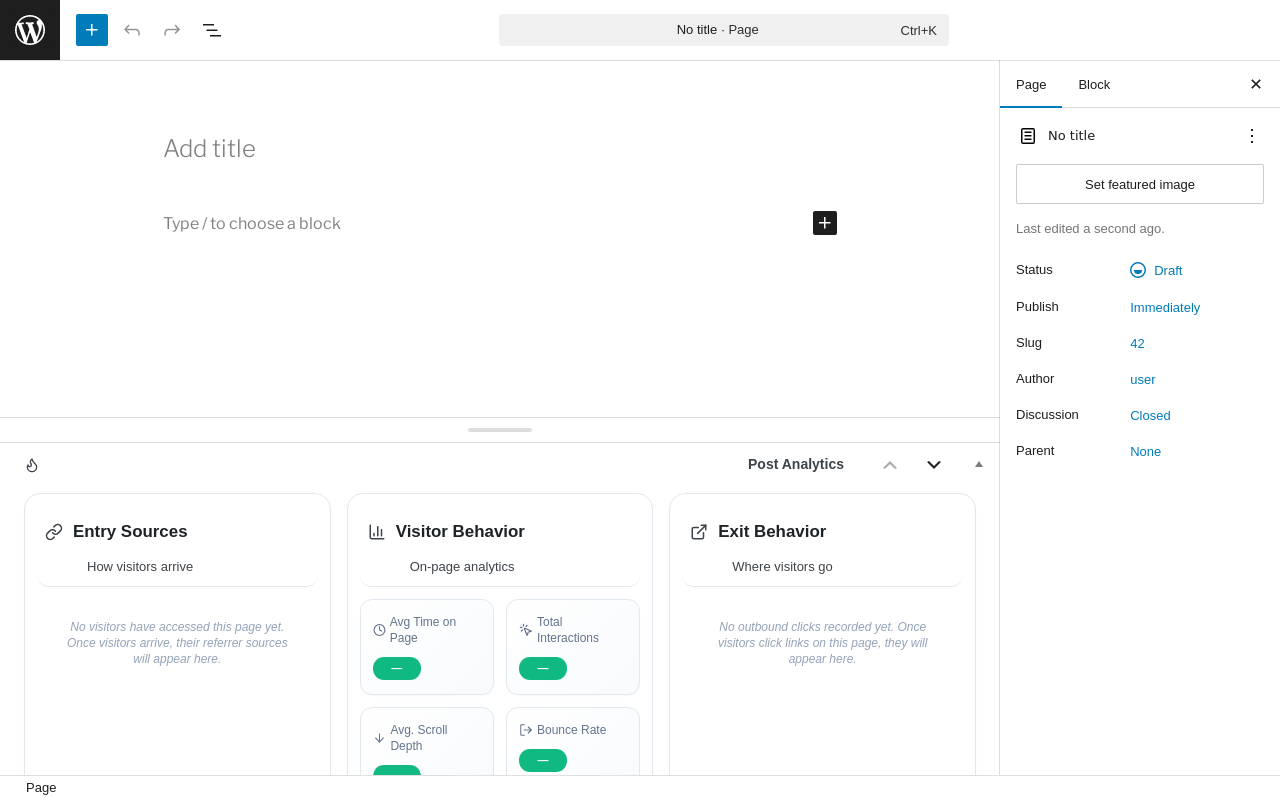
| URL | /wp-admin/post-new.php?post_type=page |
|---|---|
| Aspect | new-meta-boxes |
| HTTP status | 200 |
| Load time | 0.633 s |
| Memory usage | 6.19 MiB |
| JS errors | None |
| Resource errors | None |
Benchmark
| URL | Load time | Memory usage | ||||
|---|---|---|---|---|---|---|
| Inactive | Active | Change | Inactive | Active | Change | |
| /wp-admin/index.php | 0.420 s | 0.741 s | +0.321 s | 3.51 MiB | 3.65 MiB | + 144.15 KiB |
| /wp-admin/edit.php | 0.202 s | 0.285 s | +0.083 s | 3.57 MiB | 3.71 MiB | + 144.05 KiB |
| /wp-admin/post-new.php | 0.771 s | 1.099 s | +0.328 s | 6.06 MiB | 6.2 MiB | + 147.07 KiB |
| /wp-admin/upload.php | 0.584 s | 0.572 s | -0.012 s | 3.52 MiB | 3.65 MiB | + 126.65 KiB |
| /wp-admin/options-writing.php | 0.240 s | 0.199 s | -0.041 s | 3.5 MiB | 3.63 MiB | + 130.64 KiB |
| /wp-admin/media-new.php | 0.286 s | 0.268 s | -0.018 s | 3.49 MiB | 3.63 MiB | + 138.84 KiB |
| /wp-admin/edit-tags.php?taxonomy=category | 0.225 s | 0.209 s | -0.016 s | 3.5 MiB | 3.65 MiB | + 149.51 KiB |
| /wp-admin/post-new.php?post_type=page | 0.614 s | 1.379 s | +0.765 s | 6.05 MiB | 6.19 MiB | + 142.6 KiB |
| /wp-admin/options-discussion.php | 0.500 s | 0.324 s | -0.176 s | 3.5 MiB | 3.63 MiB | + 127.14 KiB |
| /wp-admin/edit-comments.php | 0.236 s | 0.230 s | -0.006 s | 3.52 MiB | 3.65 MiB | + 126.64 KiB |
| / | 0.301 s | 0.263 s | -0.038 s | 3.5 MiB | 3.49 MiB | - 9.95 KiB |
| Average | 0.398 s | 0.506 s | +0.108 s | 3.98 MiB | 4.1 MiB | + 124.3 KiB |
Code Statistics
Note: Third-party libraries and minified JS/CSS files are excluded from these statistics where possible, so the numbers you see here may be lower than those reported by other tools.
| Language | % | Lines of code | Comment lines | Files | |
|---|---|---|---|---|---|
| PHP | 45.4% | 15,875 | 4,993 | 33 | |
| JavaScript | 27.4% | 9,594 | 1,049 | 17 | |
| CSS | 21.4% | 7,471 | 366 | 14 | |
| PO File | 5.5% | 1,937 | 1,028 | 1 | |
| Markdown | 0.3% | 99 | 0 | 1 | |
| Total | 34,976 | 7,436 | 66 | ||
PHP Code Analysis | More results »
| Lines of code | 15,993 |
|---|---|
| Total complexity | 2,719 |
| Median class complexity | 50.0 |
| Median method complexity | 2.0 |
| Most complex class | Opti_Behavior_Heatmap_Dashboard |
| Most complex function | Opti_Behavior_Heatmap_Ajax_Handler::handle_recorder_events() |
| Classes | 18 |
|---|---|
| Methods | 371 |
| Functions | 22 |
Additions
Things that the plugin adds to the site. This section is not intended to be comprehensive. The test tool only looks for a few specific types of added content.
Database Tables 10
- wp_optibehavior_bot_visits
- wp_optibehavior_events
- wp_optibehavior_outbound_clicks
- wp_optibehavior_pages
- wp_optibehavior_pageviews
- wp_optibehavior_recordings
- wp_optibehavior_referrers
- wp_optibehavior_session_pages
- wp_optibehavior_sessions
- wp_optibehavior_visitors
Options wp_options 6
- opti_behavior_db_version
- opti_behavior_heatmap_data_protection
- opti_behavior_heatmap_last_integrity_check
- opti_behavior_heatmap_option
- optibehavior_indexes_last_checked
- optibehavior_referrers_last_backfill
Meta Boxes
{
    "post": {
        "optibehavior_editor_analytics": {
            "title": "Post Analytics",
            "context": "normal"
        }
    },
    "page": {
        "optibehavior_editor_analytics": {
            "title": "Post Analytics",
            "context": "normal"
        }
    }
}
PHP Error Log
The log file is empty.