Opti-Behavior – Self-Hosted Heatmaps, Session Recordings, Funnels, A/B Testing & Smart Insights 1.2.9
Does "Opti-Behavior – Self-Hosted Heatmaps, Session Recording & Analytics (GDPR-Native ,Free Hotjar & Clarity Alternative)" work with WordPress 6.9.4 and PHP 8.1.12? A smoke test was performed on .
Summary
| No PHP errors, warnings or notices | |
| No JavaScript exceptions | |
| All test pages loaded successfully | |
| No resource errors | |
| Looks good! No problems were detected. |
Memory usage: 380.18 KiB
The average PHP memory usage increased by this amount after activating by the plugin.
Page speed impact:
insignificant.
The plugin didn't make the site noticeably slower.
| WordPress version | 6.9.4 |
|---|---|
| PHP version | 8.1.12 |
| MySQL version | 10.6.10 |
| PHP memory limit | 512M |
| Last updated | |
|---|---|
| Active installs | 500+ |
| WordPress.org page | https://wordpress.org/plugins/opti-behavior/ |
| Badges |
|
Pages 14
Welcome to Opti-Behavior ‹ Test site — WordPress

| URL | /wp-admin/admin.php?page=opti-behavior-welcome |
|---|---|
| Requested URL | /wp-admin/plugins.php?action=activate&plugin=opti-behavior%2FOpti-Behavior.php&plugin_status=all&paged=1&s&_wpnonce=98272492b9 |
| Aspect | after-activation |
| HTTP status | 200 |
| Load time | 2.500 s |
| Memory usage | 4.07 MiB |
| JS errors | None |
| Resource errors | None |
Opti-Behavior

| URL | /wp-admin/admin.php?page=opti-behavior-welcome |
|---|---|
| Requested URL | /wp-admin/admin.php?page=opti-behavior-analytics |
| Aspect | menu-item |
| HTTP status | 200 |
| Load time | 0.400 s |
| Memory usage | 4.07 MiB |
| JS errors | None |
| Resource errors | None |
Opti-Behavior → Heatmaps

| URL | /wp-admin/admin.php?page=opti-behavior-welcome |
|---|---|
| Requested URL | /wp-admin/admin.php?page=opti-behavior-heatmaps |
| Aspect | menu-item |
| HTTP status | 200 |
| Load time | 0.362 s |
| Memory usage | 4.07 MiB |
| JS errors | None |
| Resource errors | None |
Opti-Behavior → RecordingsPRO

| URL | /wp-admin/admin.php?page=opti-behavior-welcome |
|---|---|
| Requested URL | /wp-admin/admin.php?page=opti-behavior-recordings |
| Aspect | menu-item |
| HTTP status | 200 |
| Load time | 0.475 s |
| Memory usage | 4.07 MiB |
| JS errors | None |
| Resource errors | None |
Opti-Behavior → Funnels

| URL | /wp-admin/admin.php?page=opti-behavior-welcome |
|---|---|
| Requested URL | /wp-admin/admin.php?page=opti-behavior-funnels |
| Aspect | menu-item |
| HTTP status | 200 |
| Load time | 0.390 s |
| Memory usage | 4.07 MiB |
| JS errors | None |
| Resource errors | None |
Opti-Behavior → A/B Testing
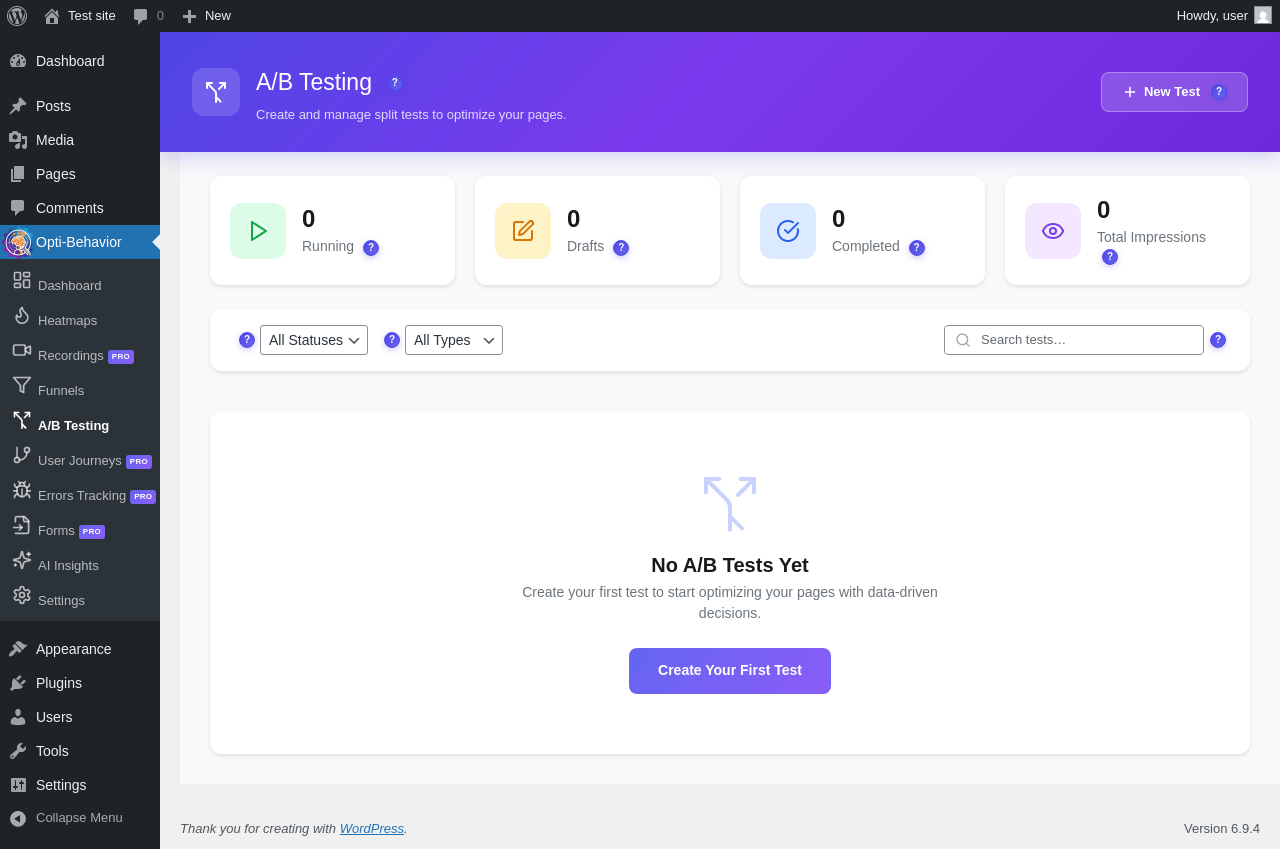
| URL | /wp-admin/admin.php?page=opti-behavior-ab-testing |
|---|---|
| Aspect | menu-item |
| HTTP status | 200 |
| Load time | 0.497 s |
| Memory usage | 4.09 MiB |
| JS errors | None |
| Resource errors | None |
Opti-Behavior → User JourneysPRO

| URL | /wp-admin/admin.php?page=opti-behavior-welcome |
|---|---|
| Requested URL | /wp-admin/admin.php?page=opti-behavior-user-journey |
| Aspect | menu-item |
| HTTP status | 200 |
| Load time | 0.387 s |
| Memory usage | 4.07 MiB |
| JS errors | None |
| Resource errors | None |
Opti-Behavior → Errors TrackingPRO
| URL | /wp-admin/admin.php?page=opti-behavior-welcome |
|---|---|
| Requested URL | /wp-admin/admin.php?page=opti-behavior-errors |
| Aspect | menu-item |
| HTTP status | 200 |
| Load time | 0.385 s |
| Memory usage | 4.07 MiB |
| JS errors | None |
| Resource errors | None |
Opti-Behavior → FormsPRO

| URL | /wp-admin/admin.php?page=opti-behavior-welcome |
|---|---|
| Requested URL | /wp-admin/admin.php?page=opti-behavior-form-analytics |
| Aspect | menu-item |
| HTTP status | 200 |
| Load time | 0.376 s |
| Memory usage | 4.07 MiB |
| JS errors | None |
| Resource errors | None |
Opti-Behavior → AI Insights

| URL | /wp-admin/admin.php?page=opti-behavior-welcome |
|---|---|
| Requested URL | /wp-admin/admin.php?page=opti-behavior-ai-insights |
| Aspect | menu-item |
| HTTP status | 200 |
| Load time | 0.946 s |
| Memory usage | 4.07 MiB |
| JS errors | None |
| Resource errors | None |
Opti-Behavior → Settings

| URL | /wp-admin/admin.php?page=opti-behavior-welcome |
|---|---|
| Requested URL | /wp-admin/admin.php?page=opti-behavior-settings |
| Aspect | menu-item |
| HTTP status | 200 |
| Load time | 0.485 s |
| Memory usage | 4.07 MiB |
| JS errors | None |
| Resource errors | None |
Test site – Just another WordPress site
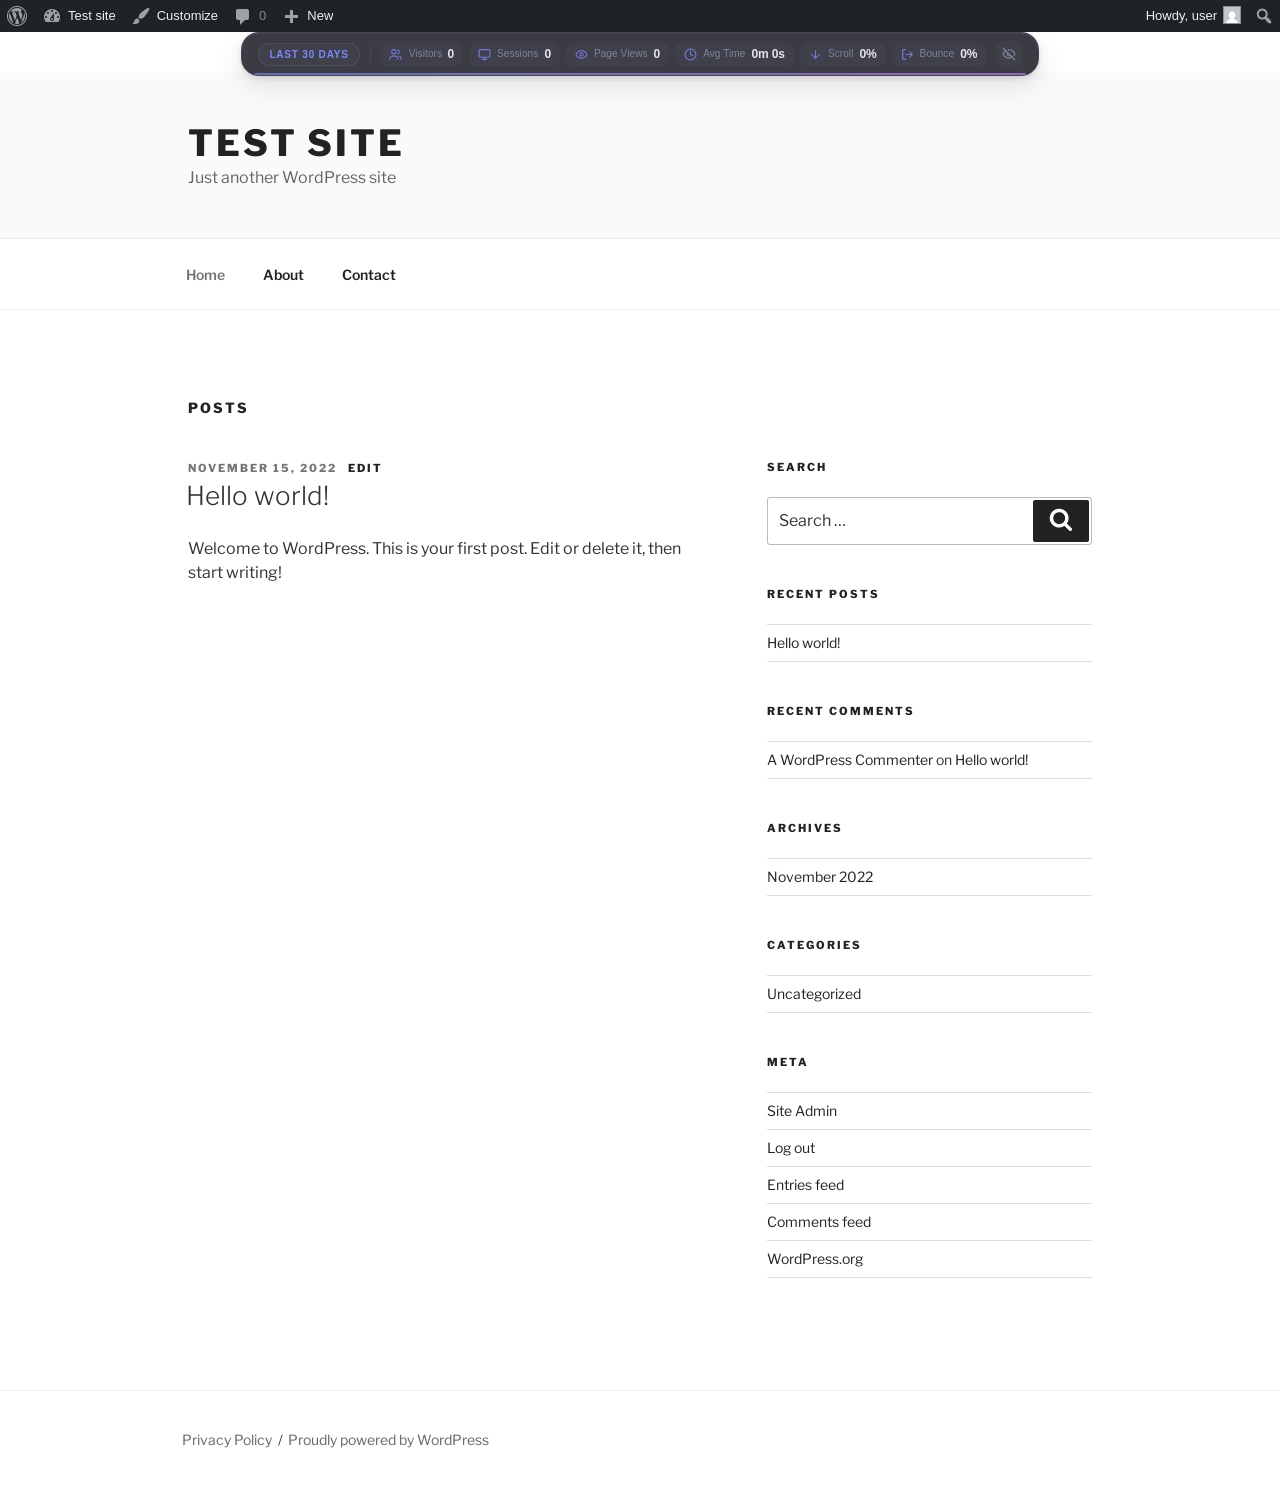
| URL | / |
|---|---|
| Aspect | front-page |
| HTTP status | 200 |
| Load time | 0.597 s |
| Memory usage | 4.46 MiB |
| JS errors | None |
| Resource errors | None |
Add Post ‹ Test site — WordPress
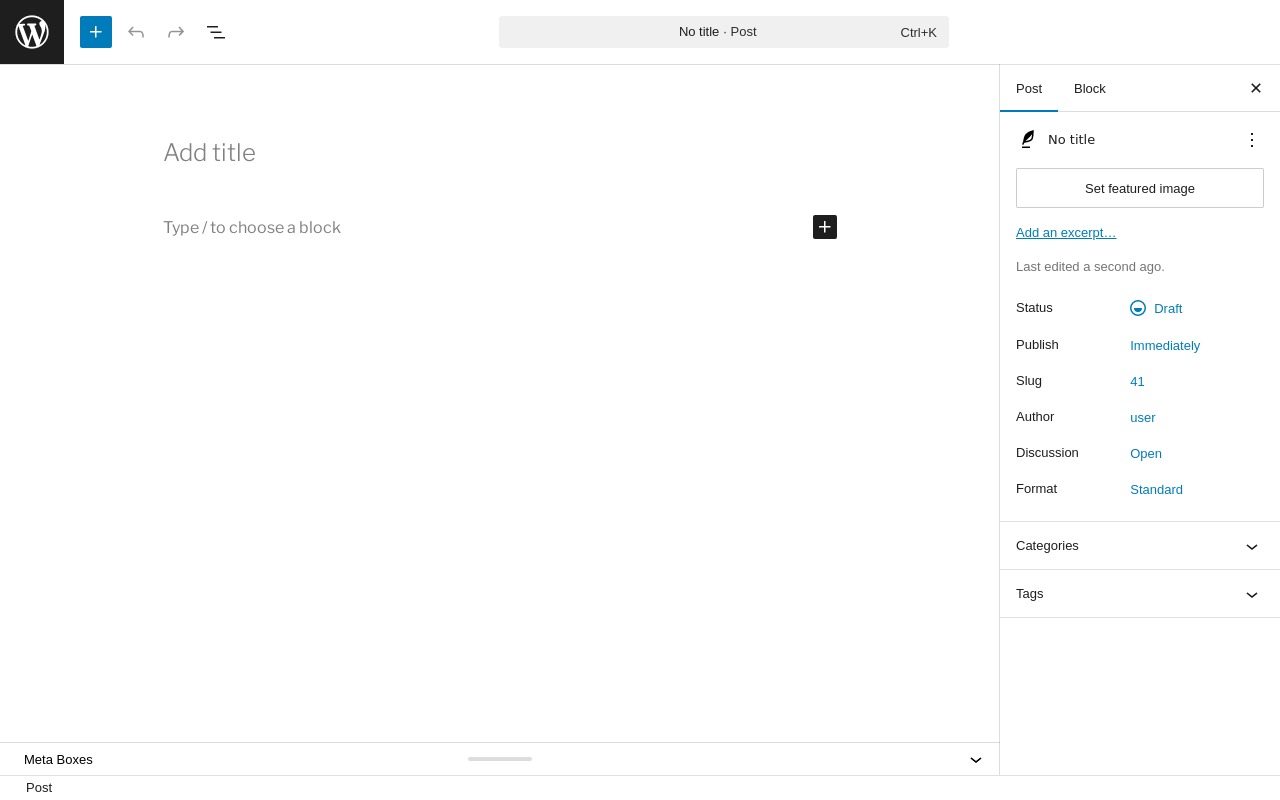
| URL | /wp-admin/post-new.php |
|---|---|
| Aspect | new-meta-boxes |
| HTTP status | 200 |
| Load time | 0.752 s |
| Memory usage | 6.72 MiB |
| JS errors | None |
| Resource errors | None |
Add Page ‹ Test site — WordPress
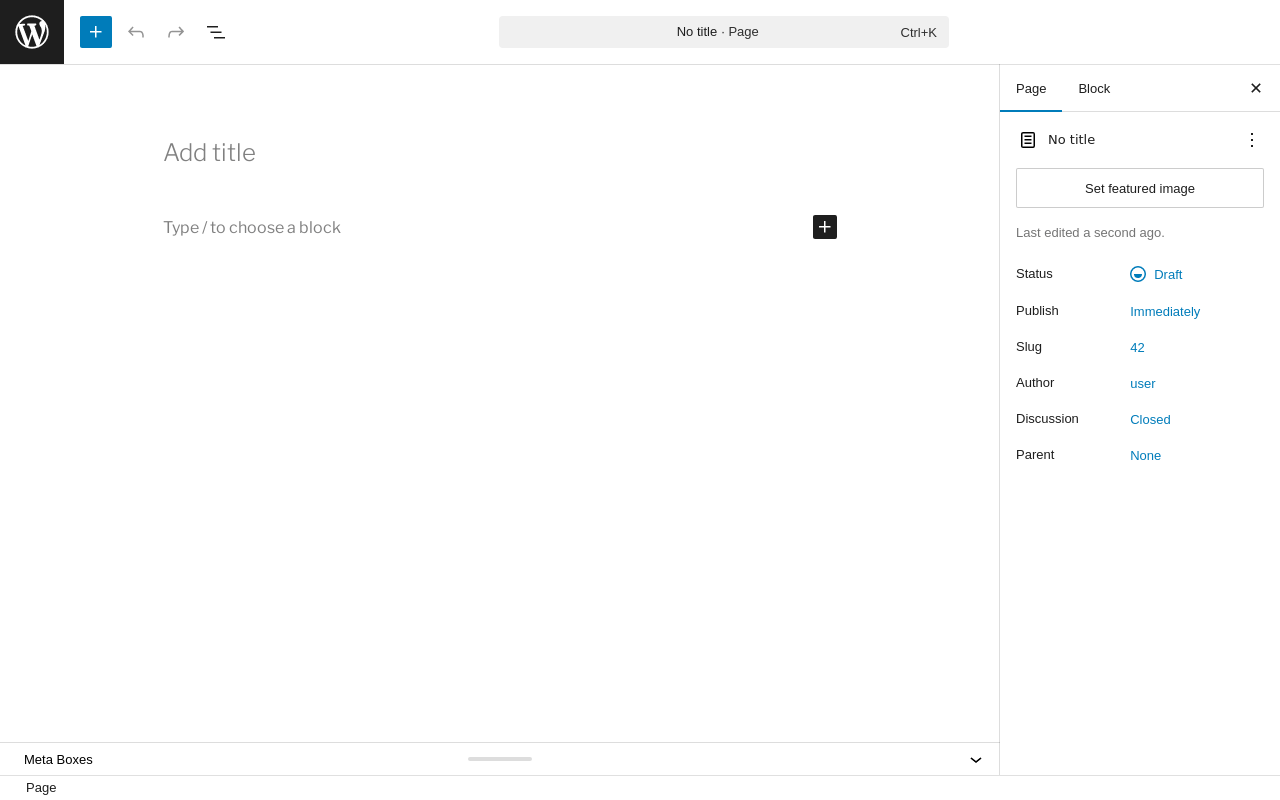
| URL | /wp-admin/post-new.php?post_type=page |
|---|---|
| Aspect | new-meta-boxes |
| HTTP status | 200 |
| Load time | 1.402 s |
| Memory usage | 6.71 MiB |
| JS errors | None |
| Resource errors | None |
Benchmark
| URL | Load time | Memory usage | ||||
|---|---|---|---|---|---|---|
| Inactive | Active | Change | Inactive | Active | Change | |
| /wp-admin/index.php | 0.507 s | 0.633 s | +0.126 s | 3.78 MiB | 4.15 MiB | + 381.78 KiB |
| /wp-admin/edit.php | 0.474 s | 0.326 s | -0.148 s | 3.78 MiB | 4.2 MiB | + 427.2 KiB |
| /wp-admin/post-new.php | 1.118 s | 1.269 s | +0.151 s | 6.31 MiB | 6.72 MiB | + 427.65 KiB |
| /wp-admin/upload.php | 0.460 s | 0.675 s | +0.215 s | 3.74 MiB | 4.09 MiB | + 363.22 KiB |
| /wp-admin/options-writing.php | 0.341 s | 0.327 s | -0.014 s | 3.71 MiB | 4.05 MiB | + 347.23 KiB |
| /wp-admin/media-new.php | 0.511 s | 0.361 s | -0.150 s | 3.7 MiB | 4.05 MiB | + 355.41 KiB |
| /wp-admin/edit-tags.php?taxonomy=category | 0.343 s | 0.332 s | -0.011 s | 3.72 MiB | 4.09 MiB | + 386.08 KiB |
| /wp-admin/post-new.php?post_type=page | 0.708 s | 0.938 s | +0.230 s | 6.3 MiB | 6.71 MiB | + 421.13 KiB |
| /wp-admin/options-discussion.php | 0.768 s | 0.390 s | -0.378 s | 3.71 MiB | 4.05 MiB | + 343.73 KiB |
| /wp-admin/edit-comments.php | 0.504 s | 0.355 s | -0.149 s | 3.73 MiB | 4.09 MiB | + 363.23 KiB |
| / | 0.308 s | 0.308 s | +0.000 s | 4.11 MiB | 4.46 MiB | + 365.39 KiB |
| Average | 0.549 s | 0.538 s | -0.012 s | 4.24 MiB | 4.61 MiB | + 380.18 KiB |
Code Statistics
Note: Third-party libraries and minified JS/CSS files are excluded from these statistics where possible, so the numbers you see here may be lower than those reported by other tools.
| Language | % | Lines of code | Comment lines | Files | |
|---|---|---|---|---|---|
| PHP | 38.9% | 41,177 | 13,253 | 64 | |
| PO File | 25.2% | 26,694 | 17,786 | 5 | |
| CSS | 18.4% | 19,504 | 1,172 | 23 | |
| JavaScript | 17.5% | 18,516 | 4,142 | 26 | |
| Total | 105,891 | 36,353 | 118 | ||
PHP Code Analysis | More results »
| Lines of code | 41,413 |
|---|---|
| Total complexity | 6,613 |
| Median class complexity | 73.5 |
| Median method complexity | 3.0 |
| Most complex class | Opti_Behavior_Heatmap_Dashboard |
| Most complex function | Opti_Behavior_Heatmap_Post_Metabox::ajax_post_analytics_chart() |
| Classes | 38 |
|---|---|
| Methods | 784 |
| Functions | 23 |
Additions
Things that the plugin adds to the site. This section is not intended to be comprehensive. The test tool only looks for a few specific types of added content.
Database Tables 29
- wp_opti_behavior_funnel_tracking
- wp_opti_behavior_funnels
- wp_optibehavior_ab_conversions
- wp_optibehavior_ab_daily_stats
- wp_optibehavior_ab_decision_log
- wp_optibehavior_ab_goals
- wp_optibehavior_ab_impressions
- wp_optibehavior_ab_tests
- wp_optibehavior_ab_variants
- wp_optibehavior_bot_visits
- wp_optibehavior_broken_links
- wp_optibehavior_daily_stats
- wp_optibehavior_error_types
- wp_optibehavior_errors
- wp_optibehavior_events
- wp_optibehavior_friction
- wp_optibehavior_heatmap_pages
- wp_optibehavior_journey_groups
- wp_optibehavior_outbound_clicks
- wp_optibehavior_pages
- wp_optibehavior_pageviews
- wp_optibehavior_performance
- wp_optibehavior_recordings
- wp_optibehavior_referrers
- wp_optibehavior_report_logs
- wp_optibehavior_report_schedules
- wp_optibehavior_session_pages
- wp_optibehavior_sessions
- wp_optibehavior_visitors
Options wp_options 11
- opti_behavior_ab_db_version
- opti_behavior_ab_free_limits
- opti_behavior_ab_metadata_backfill
- opti_behavior_ab_settings
- opti_behavior_auto_cleanup_settings
- opti_behavior_db_version
- opti_behavior_heatmap_data_protection
- opti_behavior_heatmap_last_integrity_check
- opti_behavior_heatmap_option
- opti_behavior_null_ip_migrated
- optibehavior_indexes_last_checked
Meta Boxes
{
    "post": {
        "optibehavior_editor_analytics": {
            "title": "Post Analytics",
            "context": "normal"
        }
    },
    "page": {
        "optibehavior_editor_analytics": {
            "title": "Post Analytics",
            "context": "normal"
        }
    }
}
PHP Error Log
The log file is empty.