Opti-Behavior – Self-Hosted Heatmaps, Session Recordings, Funnels & A/B Testing 1.4.0
Does "Opti-Behavior – Self-Hosted Heatmaps, Session Recordings, Funnels & A/B Testing" work with WordPress 7.0 and PHP 8.1.12? A smoke test was performed on .
Summary
| No PHP errors, warnings or notices | |
| No JavaScript exceptions | |
| All test pages loaded successfully | |
| No resource errors | |
| Looks good! No problems were detected. |
Memory usage: 408.35 KiB
The average PHP memory usage increased by this amount after activating by the plugin.
Page speed impact:
0.080 seconds
The average page load time increased by this amount after activating the plugin.
| WordPress version | 7.0 |
|---|---|
| PHP version | 8.1.12 |
| MySQL version | 10.6.10 |
| PHP memory limit | 512M |
| Last updated | |
|---|---|
| Active installs | 500+ |
| WordPress.org page | https://wordpress.org/plugins/opti-behavior/ |
| Badges |
|
Pages 14
Welcome to Opti-Behavior ‹ Test site — WordPress

| URL | /wp-admin/admin.php?page=opti-behavior-welcome |
|---|---|
| Requested URL | /wp-admin/plugins.php?action=activate&plugin=opti-behavior%2FOpti-Behavior.php&plugin_status=all&paged=1&s&_wpnonce=a46e182f22 |
| Aspect | after-activation |
| HTTP status | 200 |
| Load time | 2.877 s |
| Memory usage | 4.27 MiB |
| JS errors | None |
| Resource errors | None |
Opti-Behavior

| URL | /wp-admin/admin.php?page=opti-behavior-welcome |
|---|---|
| Requested URL | /wp-admin/admin.php?page=opti-behavior-analytics |
| Aspect | menu-item |
| HTTP status | 200 |
| Load time | 0.706 s |
| Memory usage | 4.27 MiB |
| JS errors | None |
| Resource errors | None |
Opti-Behavior → Heatmaps

| URL | /wp-admin/admin.php?page=opti-behavior-welcome |
|---|---|
| Requested URL | /wp-admin/admin.php?page=opti-behavior-heatmaps |
| Aspect | menu-item |
| HTTP status | 200 |
| Load time | 0.886 s |
| Memory usage | 4.27 MiB |
| JS errors | None |
| Resource errors | None |
Opti-Behavior → RecordingsPRO

| URL | /wp-admin/admin.php?page=opti-behavior-welcome |
|---|---|
| Requested URL | /wp-admin/admin.php?page=opti-behavior-recordings |
| Aspect | menu-item |
| HTTP status | 200 |
| Load time | 0.680 s |
| Memory usage | 4.27 MiB |
| JS errors | None |
| Resource errors | None |
Opti-Behavior → Funnels

| URL | /wp-admin/admin.php?page=opti-behavior-welcome |
|---|---|
| Requested URL | /wp-admin/admin.php?page=opti-behavior-funnels |
| Aspect | menu-item |
| HTTP status | 200 |
| Load time | 0.664 s |
| Memory usage | 4.27 MiB |
| JS errors | None |
| Resource errors | None |
Opti-Behavior → A/B Testing
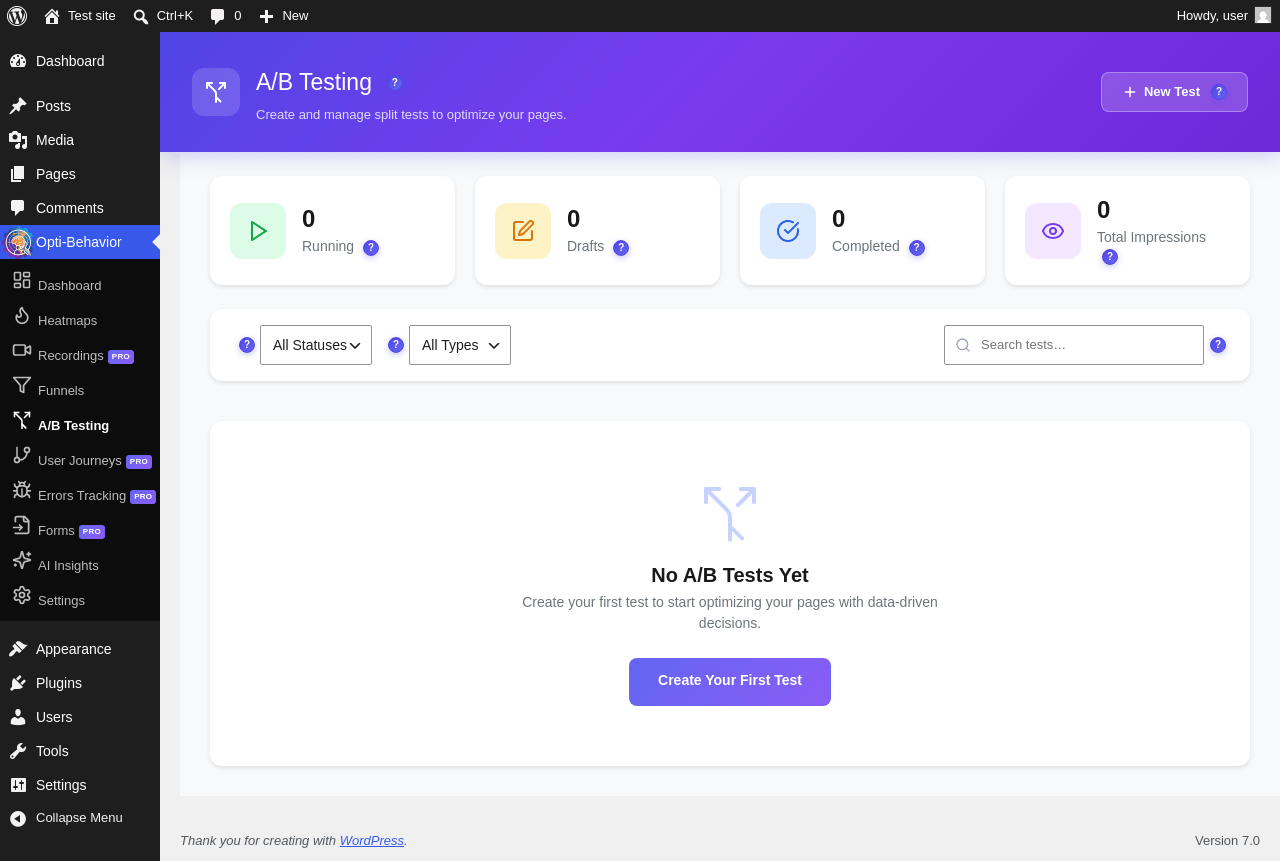
| URL | /wp-admin/admin.php?page=opti-behavior-ab-testing |
|---|---|
| Aspect | menu-item |
| HTTP status | 200 |
| Load time | 0.953 s |
| Memory usage | 4.28 MiB |
| JS errors | None |
| Resource errors | None |
Opti-Behavior → User JourneysPRO

| URL | /wp-admin/admin.php?page=opti-behavior-welcome |
|---|---|
| Requested URL | /wp-admin/admin.php?page=opti-behavior-user-journey |
| Aspect | menu-item |
| HTTP status | 200 |
| Load time | 0.646 s |
| Memory usage | 4.27 MiB |
| JS errors | None |
| Resource errors | None |
Opti-Behavior → Errors TrackingPRO
| URL | /wp-admin/admin.php?page=opti-behavior-welcome |
|---|---|
| Requested URL | /wp-admin/admin.php?page=opti-behavior-errors |
| Aspect | menu-item |
| HTTP status | 200 |
| Load time | 0.684 s |
| Memory usage | 4.27 MiB |
| JS errors | None |
| Resource errors | None |
Opti-Behavior → FormsPRO

| URL | /wp-admin/admin.php?page=opti-behavior-welcome |
|---|---|
| Requested URL | /wp-admin/admin.php?page=opti-behavior-form-analytics |
| Aspect | menu-item |
| HTTP status | 200 |
| Load time | 1.076 s |
| Memory usage | 4.27 MiB |
| JS errors | None |
| Resource errors | None |
Opti-Behavior → AI Insights

| URL | /wp-admin/admin.php?page=opti-behavior-welcome |
|---|---|
| Requested URL | /wp-admin/admin.php?page=opti-behavior-ai-insights |
| Aspect | menu-item |
| HTTP status | 200 |
| Load time | 0.684 s |
| Memory usage | 4.27 MiB |
| JS errors | None |
| Resource errors | None |
Opti-Behavior → Settings

| URL | /wp-admin/admin.php?page=opti-behavior-welcome |
|---|---|
| Requested URL | /wp-admin/admin.php?page=opti-behavior-settings |
| Aspect | menu-item |
| HTTP status | 200 |
| Load time | 0.659 s |
| Memory usage | 4.27 MiB |
| JS errors | None |
| Resource errors | None |
Test site – Just another WordPress site
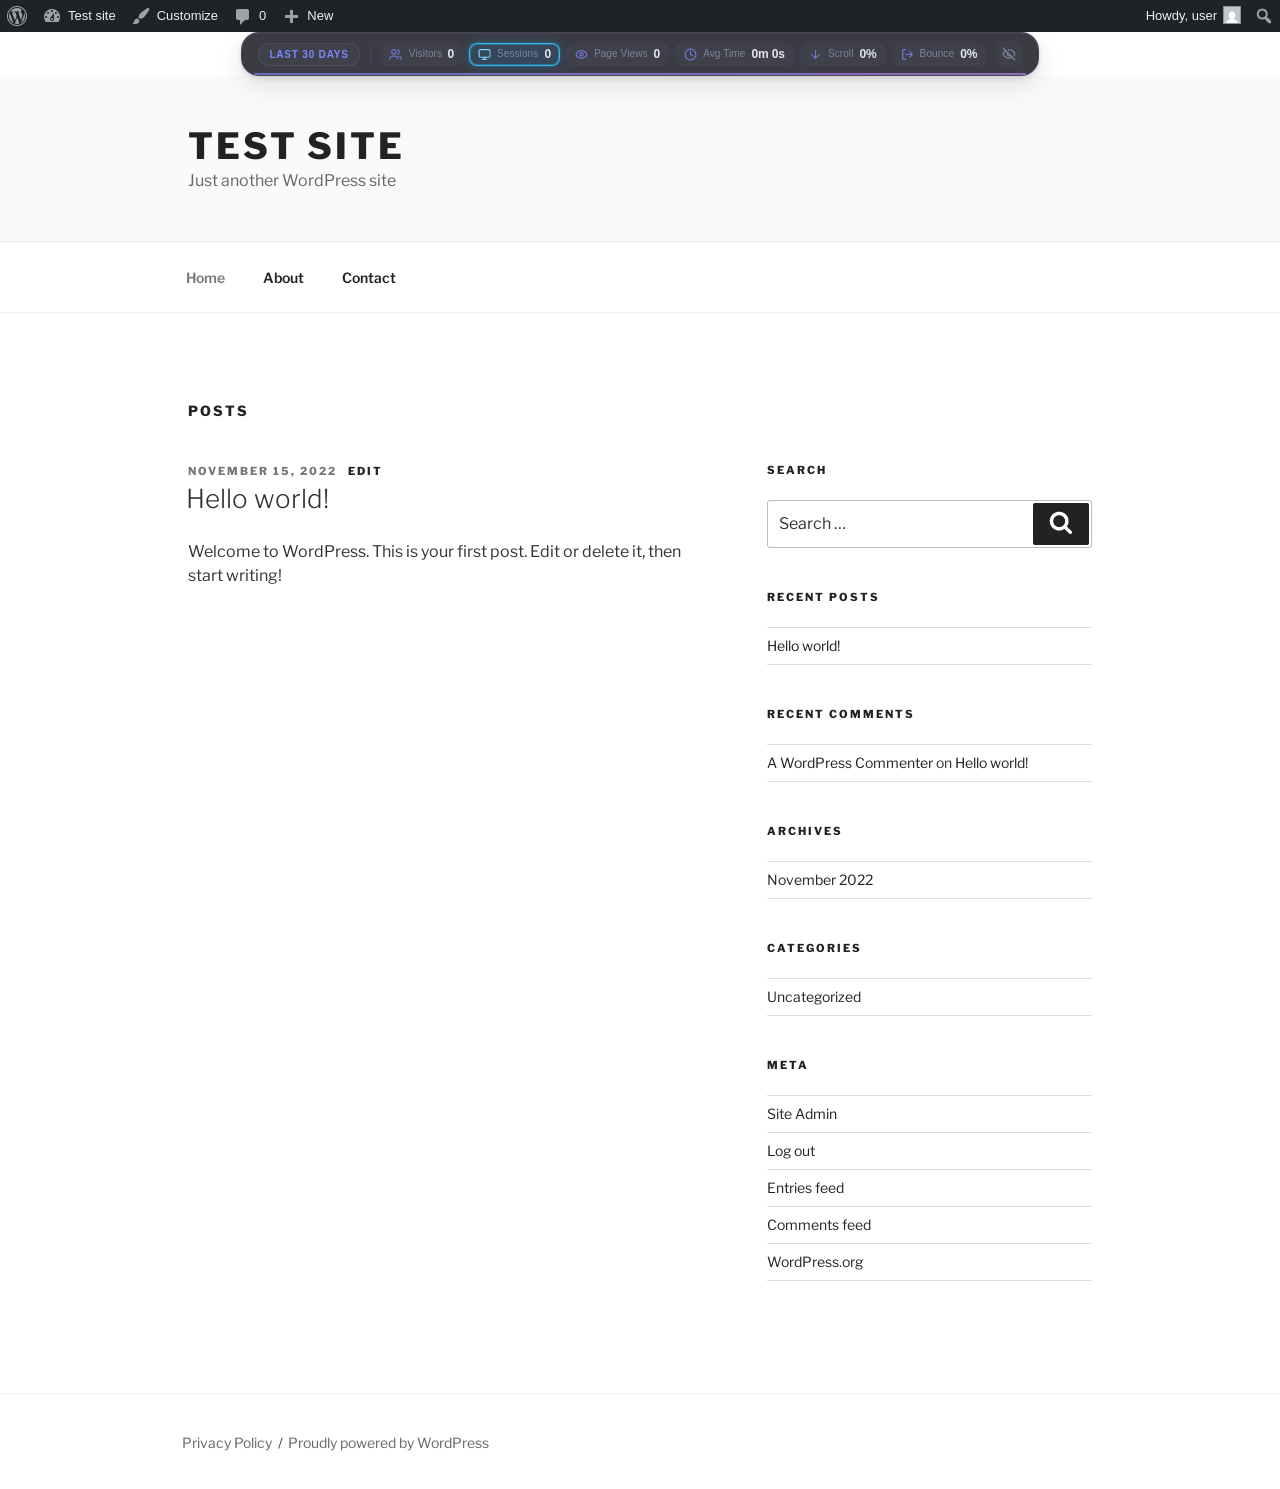
| URL | / |
|---|---|
| Aspect | front-page |
| HTTP status | 200 |
| Load time | 0.521 s |
| Memory usage | 4.61 MiB |
| JS errors | None |
| Resource errors | None |
Add Post ‹ Test site — WordPress
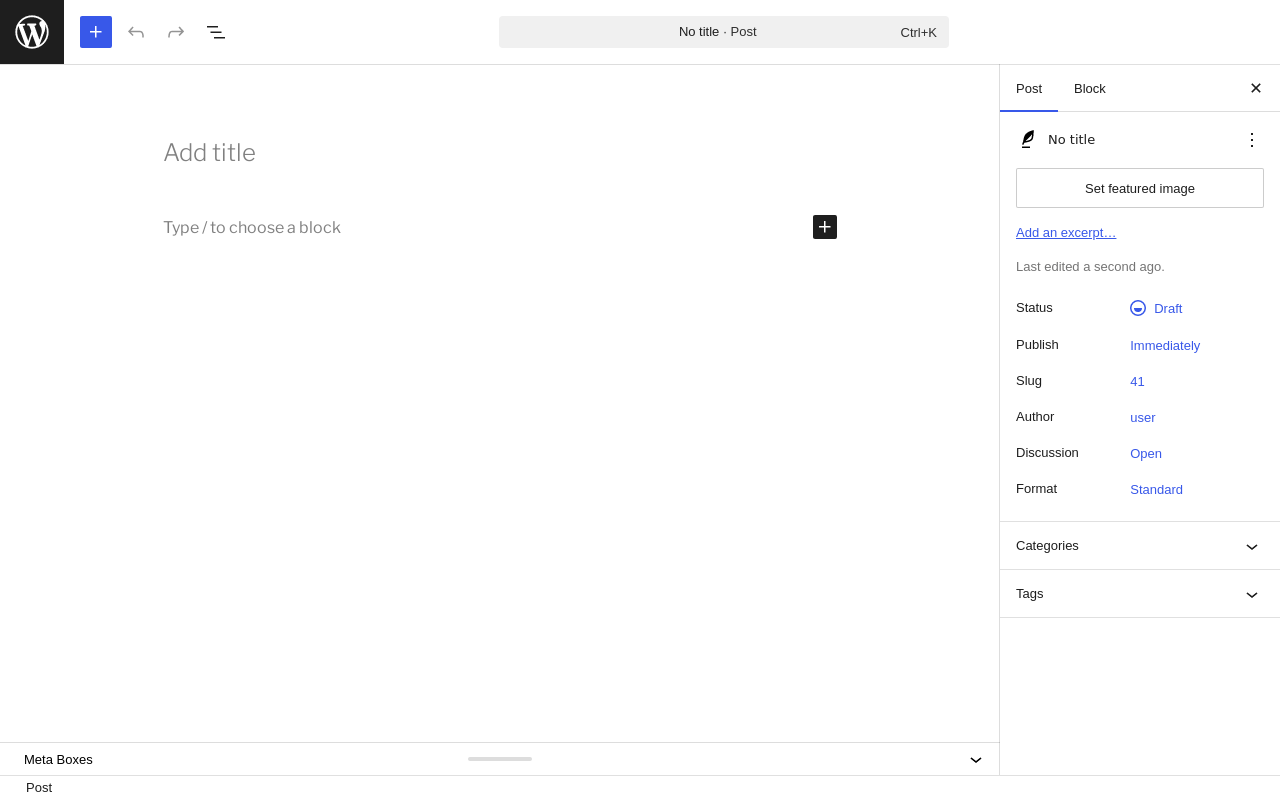
| URL | /wp-admin/post-new.php |
|---|---|
| Aspect | new-meta-boxes |
| HTTP status | 200 |
| Load time | 1.642 s |
| Memory usage | 6.98 MiB |
| JS errors | None |
| Resource errors | None |
Add Page ‹ Test site — WordPress
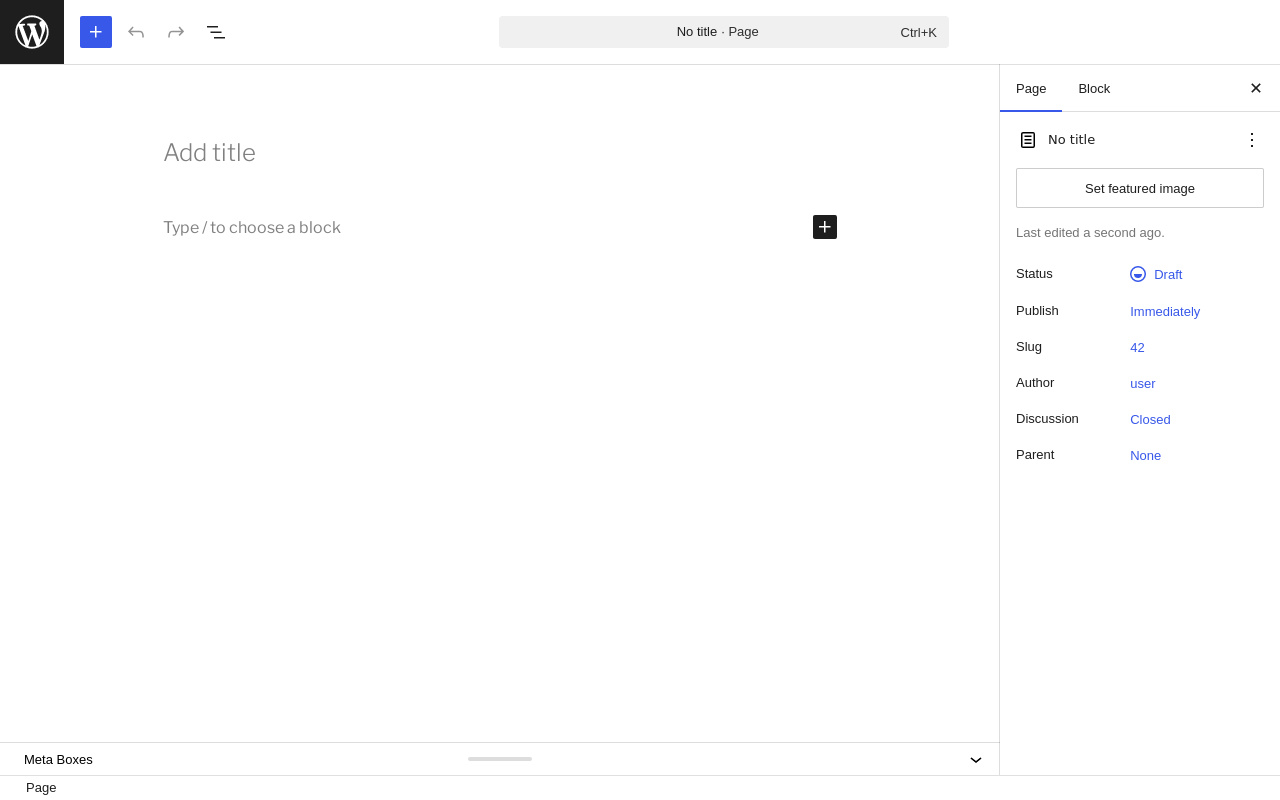
| URL | /wp-admin/post-new.php?post_type=page |
|---|---|
| Aspect | new-meta-boxes |
| HTTP status | 200 |
| Load time | 1.595 s |
| Memory usage | 6.96 MiB |
| JS errors | None |
| Resource errors | None |
Benchmark
| URL | Load time | Memory usage | ||||
|---|---|---|---|---|---|---|
| Inactive | Active | Change | Inactive | Active | Change | |
| /wp-admin/index.php | 0.771 s | 0.829 s | +0.058 s | 3.93 MiB | 4.38 MiB | + 461.78 KiB |
| /wp-admin/edit.php | 0.620 s | 1.327 s | +0.707 s | 3.98 MiB | 4.37 MiB | + 397.09 KiB |
| /wp-admin/post-new.php | 2.340 s | 1.987 s | -0.353 s | 6.56 MiB | 6.98 MiB | + 429.59 KiB |
| /wp-admin/upload.php | 0.861 s | 0.741 s | -0.120 s | 3.89 MiB | 4.27 MiB | + 392.41 KiB |
| /wp-admin/options-writing.php | 0.605 s | 1.095 s | +0.490 s | 3.86 MiB | 4.24 MiB | + 383.49 KiB |
| /wp-admin/media-new.php | 1.095 s | 0.682 s | -0.413 s | 3.85 MiB | 4.24 MiB | + 391.66 KiB |
| /wp-admin/edit-tags.php?taxonomy=category | 0.610 s | 0.680 s | +0.070 s | 3.86 MiB | 4.25 MiB | + 396.83 KiB |
| /wp-admin/post-new.php?post_type=page | 1.723 s | 2.142 s | +0.419 s | 6.55 MiB | 6.96 MiB | + 425.12 KiB |
| /wp-admin/options-discussion.php | 0.686 s | 0.676 s | -0.010 s | 3.86 MiB | 4.24 MiB | + 379.99 KiB |
| /wp-admin/edit-comments.php | 0.614 s | 0.614 s | +0.000 s | 3.89 MiB | 4.32 MiB | + 443.99 KiB |
| / | 0.346 s | 0.383 s | +0.037 s | 4.23 MiB | 4.61 MiB | + 389.87 KiB |
| Average | 0.934 s | 1.014 s | +0.080 s | 4.41 MiB | 4.8 MiB | + 408.35 KiB |
Code Statistics
Note: Third-party libraries and minified JS/CSS files are excluded from these statistics where possible, so the numbers you see here may be lower than those reported by other tools.
| Language | % | Lines of code | Comment lines | Files | |
|---|---|---|---|---|---|
| PHP | 39.6% | 43,423 | 14,006 | 67 | |
| PO File | 24.6% | 26,924 | 17,901 | 5 | |
| CSS | 18.3% | 20,027 | 1,180 | 25 | |
| JavaScript | 17.6% | 19,296 | 4,172 | 27 | |
| Total | 109,670 | 37,259 | 124 | ||
PHP Code Analysis | More results »
| Lines of code | 43,662 |
|---|---|
| Total complexity | 7,041 |
| Median class complexity | 71.0 |
| Median method complexity | 3.0 |
| Most complex class | Opti_Behavior_Heatmap_Dashboard |
| Most complex function | Opti_Behavior_Heatmap_Post_Metabox::ajax_post_analytics_chart() |
| Classes | 41 |
|---|---|
| Methods | 878 |
| Functions | 23 |
Additions
Things that the plugin adds to the site. This section is not intended to be comprehensive. The test tool only looks for a few specific types of added content.
Database Tables 29
- wp_opti_behavior_funnel_tracking
- wp_opti_behavior_funnels
- wp_optibehavior_ab_conversions
- wp_optibehavior_ab_daily_stats
- wp_optibehavior_ab_decision_log
- wp_optibehavior_ab_goals
- wp_optibehavior_ab_impressions
- wp_optibehavior_ab_tests
- wp_optibehavior_ab_variants
- wp_optibehavior_bot_visits
- wp_optibehavior_broken_links
- wp_optibehavior_daily_stats
- wp_optibehavior_error_types
- wp_optibehavior_errors
- wp_optibehavior_events
- wp_optibehavior_friction
- wp_optibehavior_heatmap_pages
- wp_optibehavior_journey_groups
- wp_optibehavior_outbound_clicks
- wp_optibehavior_pages
- wp_optibehavior_pageviews
- wp_optibehavior_performance
- wp_optibehavior_recordings
- wp_optibehavior_referrers
- wp_optibehavior_report_logs
- wp_optibehavior_report_schedules
- wp_optibehavior_session_pages
- wp_optibehavior_sessions
- wp_optibehavior_visitors
Options wp_options 12
- opti_behavior_ab_db_version
- opti_behavior_ab_free_limits
- opti_behavior_ab_metadata_backfill
- opti_behavior_ab_settings
- opti_behavior_auto_cleanup_settings
- opti_behavior_db_version
- opti_behavior_heatmap_data_protection
- opti_behavior_heatmap_last_integrity_check
- opti_behavior_heatmap_option
- opti_behavior_null_ip_migrated
- opti_behavior_review_installed_at
- optibehavior_indexes_last_checked
Meta Boxes
{
    "post": {
        "optibehavior_editor_analytics": {
            "title": "Post Analytics",
            "context": "normal"
        }
    },
    "page": {
        "optibehavior_editor_analytics": {
            "title": "Post Analytics",
            "context": "normal"
        }
    }
}
PHP Error Log
The log file is empty.