Opti-Behavior – Self-Hosted Heatmaps, Session Recordings, Funnels, A/B Testing & Smart Insights 1.6.0
Does "Opti-Behavior – Self-Hosted Heatmaps, Session Recordings, Funnels, A/B Testing & Smart Insights" work with WordPress 7.0 and PHP 8.1.12? A smoke test was performed on .
Summary
| No PHP errors, warnings or notices | |
| No JavaScript exceptions | |
| All test pages loaded successfully | |
| No resource errors | |
| Looks good! No problems were detected. |
Memory usage: 438.68 KiB
The average PHP memory usage increased by this amount after activating by the plugin.
Page speed impact:
0.028 seconds
The average page load time increased by this amount after activating the plugin.
| WordPress version | 7.0 |
|---|---|
| PHP version | 8.1.12 |
| MySQL version | 10.6.10 |
| PHP memory limit | 512M |
| Last updated | |
|---|---|
| Active installs | 500+ |
| WordPress.org page | https://wordpress.org/plugins/opti-behavior/ |
| Badges |
|
Pages 15
Welcome to Opti-Behavior ‹ Test site — WordPress

| URL | /wp-admin/admin.php?page=opti-behavior-welcome |
|---|---|
| Requested URL | /wp-admin/plugins.php?action=activate&plugin=opti-behavior%2FOpti-Behavior.php&plugin_status=all&paged=1&s&_wpnonce=e43e2988fb |
| Aspect | after-activation |
| HTTP status | 200 |
| Load time | 3.171 s |
| Memory usage | 4.3 MiB |
| JS errors | None |
| Resource errors | None |
Opti-Behavior

| URL | /wp-admin/admin.php?page=opti-behavior-welcome |
|---|---|
| Requested URL | /wp-admin/admin.php?page=opti-behavior-analytics |
| Aspect | menu-item |
| HTTP status | 200 |
| Load time | 0.695 s |
| Memory usage | 4.3 MiB |
| JS errors | None |
| Resource errors | None |
Opti-Behavior → Heatmaps

| URL | /wp-admin/admin.php?page=opti-behavior-welcome |
|---|---|
| Requested URL | /wp-admin/admin.php?page=opti-behavior-heatmaps |
| Aspect | menu-item |
| HTTP status | 200 |
| Load time | 0.662 s |
| Memory usage | 4.3 MiB |
| JS errors | None |
| Resource errors | None |
Opti-Behavior → RecordingsPRO

| URL | /wp-admin/admin.php?page=opti-behavior-welcome |
|---|---|
| Requested URL | /wp-admin/admin.php?page=opti-behavior-recordings |
| Aspect | menu-item |
| HTTP status | 200 |
| Load time | 0.791 s |
| Memory usage | 4.3 MiB |
| JS errors | None |
| Resource errors | None |
Opti-Behavior → Funnels

| URL | /wp-admin/admin.php?page=opti-behavior-welcome |
|---|---|
| Requested URL | /wp-admin/admin.php?page=opti-behavior-funnels |
| Aspect | menu-item |
| HTTP status | 200 |
| Load time | 0.639 s |
| Memory usage | 4.3 MiB |
| JS errors | None |
| Resource errors | None |
Opti-Behavior → A/B Testing

| URL | /wp-admin/admin.php?page=opti-behavior-welcome |
|---|---|
| Requested URL | /wp-admin/admin.php?page=opti-behavior-ab-testing |
| Aspect | menu-item |
| HTTP status | 200 |
| Load time | 0.671 s |
| Memory usage | 4.3 MiB |
| JS errors | None |
| Resource errors | None |
Opti-Behavior → User JourneysPRO

| URL | /wp-admin/admin.php?page=opti-behavior-welcome |
|---|---|
| Requested URL | /wp-admin/admin.php?page=opti-behavior-user-journey |
| Aspect | menu-item |
| HTTP status | 200 |
| Load time | 0.831 s |
| Memory usage | 4.3 MiB |
| JS errors | None |
| Resource errors | None |
Opti-Behavior → Errors TrackingPRO
| URL | /wp-admin/admin.php?page=opti-behavior-welcome |
|---|---|
| Requested URL | /wp-admin/admin.php?page=opti-behavior-errors |
| Aspect | menu-item |
| HTTP status | 200 |
| Load time | 0.645 s |
| Memory usage | 4.3 MiB |
| JS errors | None |
| Resource errors | None |
Opti-Behavior → FormsPRO

| URL | /wp-admin/admin.php?page=opti-behavior-welcome |
|---|---|
| Requested URL | /wp-admin/admin.php?page=opti-behavior-form-analytics |
| Aspect | menu-item |
| HTTP status | 200 |
| Load time | 0.657 s |
| Memory usage | 4.3 MiB |
| JS errors | None |
| Resource errors | None |
Opti-Behavior → Insights

| URL | /wp-admin/admin.php?page=opti-behavior-welcome |
|---|---|
| Requested URL | /wp-admin/admin.php?page=opti-behavior-smart-insights |
| Aspect | menu-item |
| HTTP status | 200 |
| Load time | 0.817 s |
| Memory usage | 4.3 MiB |
| JS errors | None |
| Resource errors | None |
Opti-Behavior → Settings

| URL | /wp-admin/admin.php?page=opti-behavior-welcome |
|---|---|
| Requested URL | /wp-admin/admin.php?page=opti-behavior-settings |
| Aspect | menu-item |
| HTTP status | 200 |
| Load time | 0.638 s |
| Memory usage | 4.3 MiB |
| JS errors | None |
| Resource errors | None |
Opti-Behavior → Roadmap

| URL | /wp-admin/admin.php?page=opti-behavior-welcome |
|---|---|
| Requested URL | /wp-admin/admin.php?page=opti-behavior-ai-insights |
| Aspect | menu-item |
| HTTP status | 200 |
| Load time | 0.626 s |
| Memory usage | 4.3 MiB |
| JS errors | None |
| Resource errors | None |
Test site – Just another WordPress site
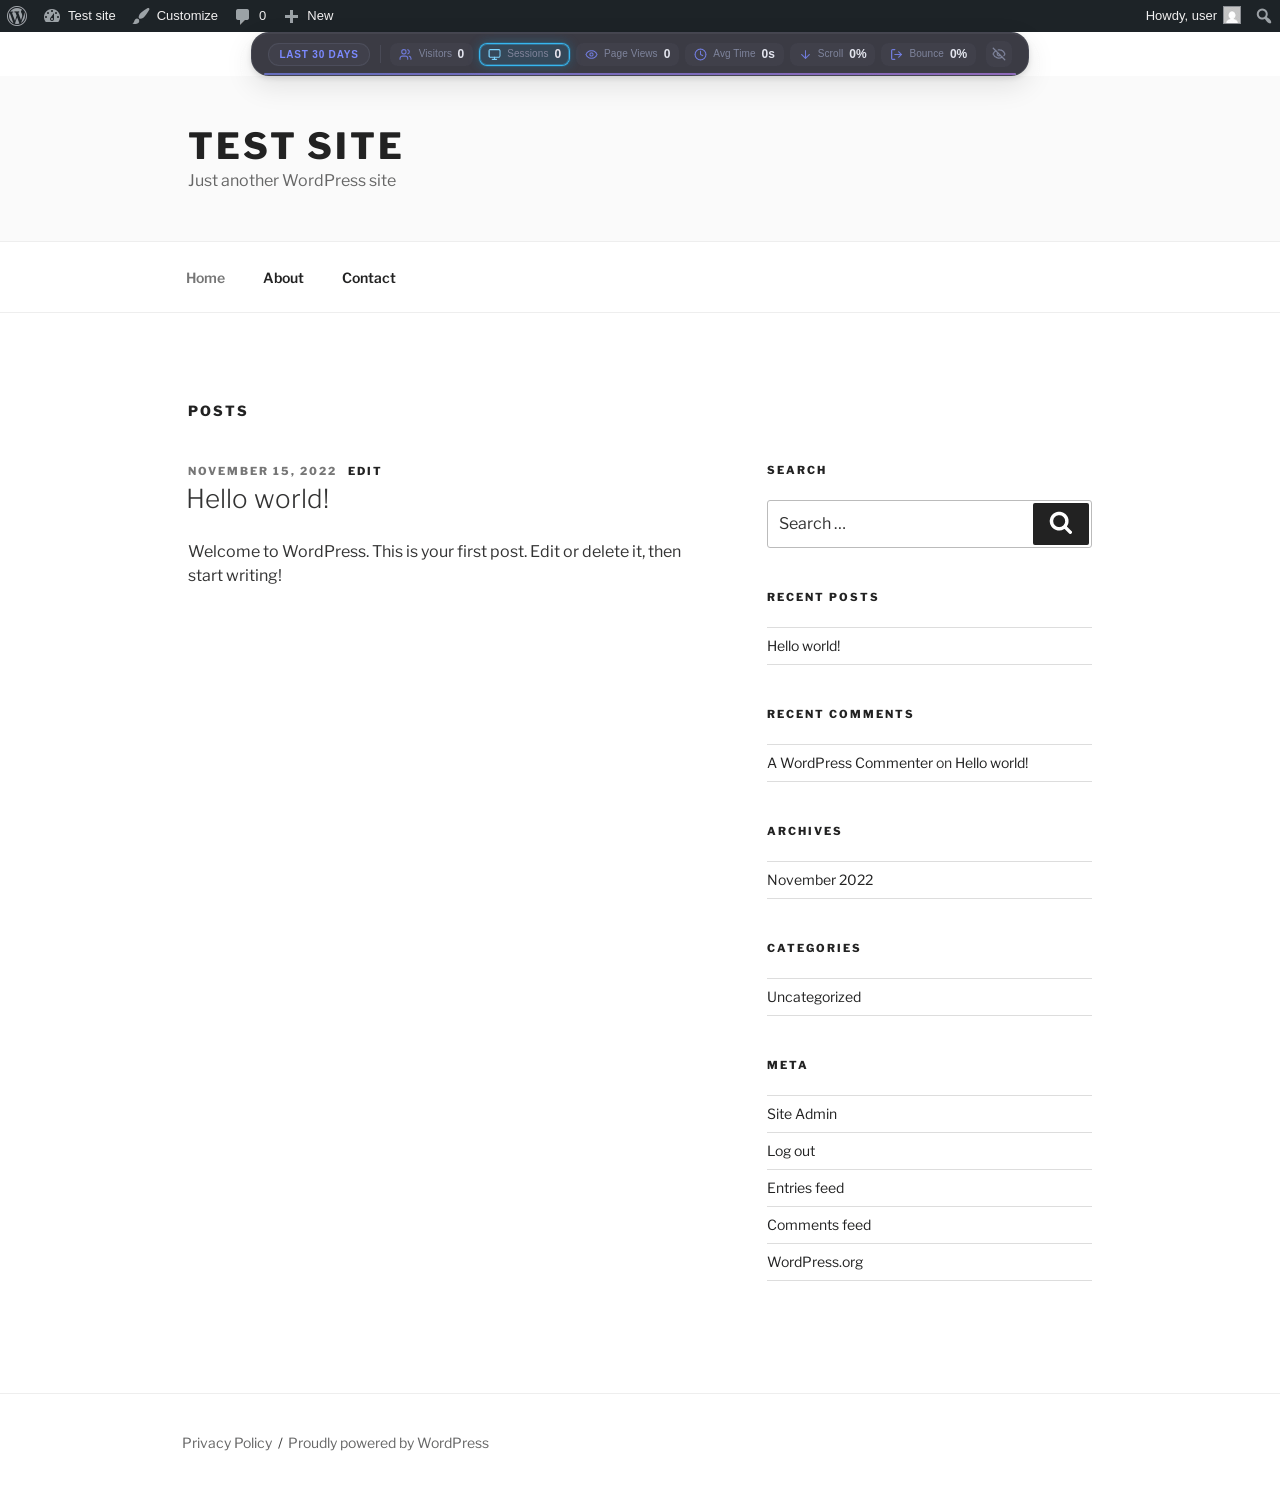
| URL | / |
|---|---|
| Aspect | front-page |
| HTTP status | 200 |
| Load time | 0.463 s |
| Memory usage | 4.62 MiB |
| JS errors | None |
| Resource errors | None |
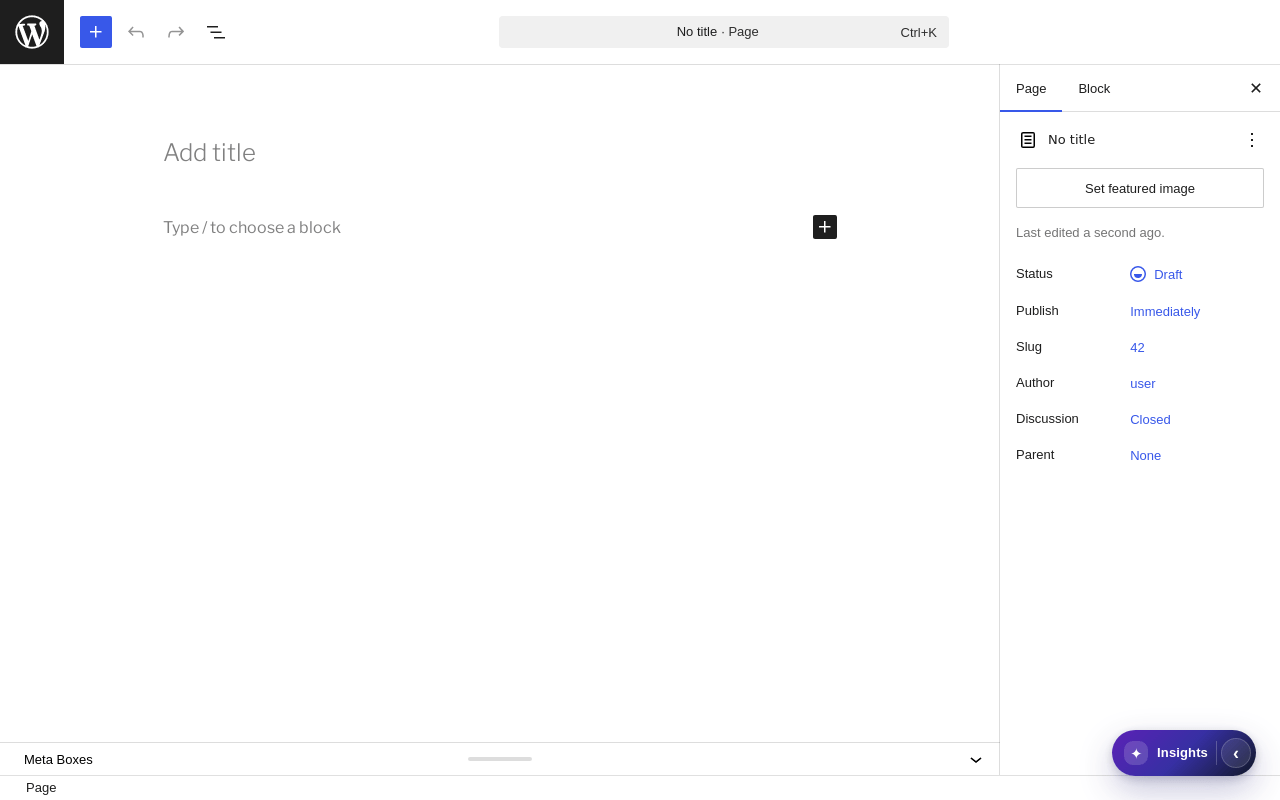
Add Post ‹ Test site — WordPress

| URL | /wp-admin/post-new.php |
|---|---|
| Aspect | new-meta-boxes |
| HTTP status | 200 |
| Load time | 1.926 s |
| Memory usage | 7.01 MiB |
| JS errors | None |
| Resource errors | None |
Add Page ‹ Test site — WordPress
| URL | /wp-admin/post-new.php?post_type=page |
|---|---|
| Aspect | new-meta-boxes |
| HTTP status | 200 |
| Load time | 1.494 s |
| Memory usage | 7 MiB |
| JS errors | None |
| Resource errors | None |
Benchmark
| URL | Load time | Memory usage | ||||
|---|---|---|---|---|---|---|
| Inactive | Active | Change | Inactive | Active | Change | |
| /wp-admin/index.php | 0.755 s | 0.882 s | +0.127 s | 3.93 MiB | 4.41 MiB | + 495.55 KiB |
| /wp-admin/edit.php | 0.597 s | 0.587 s | -0.010 s | 3.98 MiB | 4.4 MiB | + 429.92 KiB |
| /wp-admin/post-new.php | 2.100 s | 2.018 s | -0.082 s | 6.56 MiB | 7.01 MiB | + 464.14 KiB |
| /wp-admin/upload.php | 0.695 s | 0.694 s | -0.001 s | 3.89 MiB | 4.3 MiB | + 425.25 KiB |
| /wp-admin/options-writing.php | 0.544 s | 0.553 s | +0.009 s | 3.86 MiB | 4.27 MiB | + 416.64 KiB |
| /wp-admin/media-new.php | 0.933 s | 0.594 s | -0.339 s | 3.85 MiB | 4.27 MiB | + 424.8 KiB |
| /wp-admin/edit-tags.php?taxonomy=category | 0.531 s | 0.894 s | +0.363 s | 3.86 MiB | 4.28 MiB | + 429.66 KiB |
| /wp-admin/post-new.php?post_type=page | 1.904 s | 1.647 s | -0.257 s | 6.55 MiB | 7 MiB | + 459.66 KiB |
| /wp-admin/options-discussion.php | 0.630 s | 1.018 s | +0.388 s | 3.86 MiB | 4.27 MiB | + 412.83 KiB |
| /wp-admin/edit-comments.php | 0.529 s | 0.590 s | +0.061 s | 3.89 MiB | 4.34 MiB | + 466.14 KiB |
| / | 0.296 s | 0.346 s | +0.050 s | 4.23 MiB | 4.62 MiB | + 400.92 KiB |
| Average | 0.865 s | 0.893 s | +0.028 s | 4.41 MiB | 4.83 MiB | + 438.68 KiB |
Code Statistics
Note: Third-party libraries and minified JS/CSS files are excluded from these statistics where possible, so the numbers you see here may be lower than those reported by other tools.
| Language | % | Lines of code | Comment lines | Files | |
|---|---|---|---|---|---|
| PHP | 37.4% | 57,397 | 18,598 | 97 | |
| PO File | 29.7% | 45,532 | 19,730 | 5 | |
| CSS | 17.2% | 26,381 | 1,208 | 26 | |
| JavaScript | 15.8% | 24,184 | 4,213 | 29 | |
| Total | 153,494 | 43,749 | 157 | ||
PHP Code Analysis | More results »
| Lines of code | 57,665 |
|---|---|
| Total complexity | 10,741 |
| Median class complexity | 63.0 |
| Median method complexity | 3.0 |
| Most complex class | Opti_Behavior_Heatmap_Dashboard |
| Most complex function | Opti_Behavior_AB_Test_Page::render_builder() |
| Classes | 71 |
|---|---|
| Methods | 1,385 |
| Functions | 24 |
Additions
Things that the plugin adds to the site. This section is not intended to be comprehensive. The test tool only looks for a few specific types of added content.
Database Tables 30
- wp_opti_behavior_funnel_tracking
- wp_opti_behavior_funnels
- wp_optibehavior_ab_conversions
- wp_optibehavior_ab_daily_stats
- wp_optibehavior_ab_decision_log
- wp_optibehavior_ab_goals
- wp_optibehavior_ab_impressions
- wp_optibehavior_ab_tests
- wp_optibehavior_ab_variants
- wp_optibehavior_bot_visits
- wp_optibehavior_broken_links
- wp_optibehavior_daily_stats
- wp_optibehavior_error_types
- wp_optibehavior_errors
- wp_optibehavior_events
- wp_optibehavior_friction
- wp_optibehavior_heatmap_pages
- wp_optibehavior_insights
- wp_optibehavior_journey_groups
- wp_optibehavior_outbound_clicks
- wp_optibehavior_pages
- wp_optibehavior_pageviews
- wp_optibehavior_performance
- wp_optibehavior_recordings
- wp_optibehavior_referrers
- wp_optibehavior_report_logs
- wp_optibehavior_report_schedules
- wp_optibehavior_session_pages
- wp_optibehavior_sessions
- wp_optibehavior_visitors
Options wp_options 13
- opti_behavior_ab_db_version
- opti_behavior_ab_free_limits
- opti_behavior_ab_metadata_backfill
- opti_behavior_ab_settings
- opti_behavior_auto_cleanup_settings
- opti_behavior_db_version
- opti_behavior_heatmap_data_protection
- opti_behavior_heatmap_last_integrity_check
- opti_behavior_heatmap_option
- opti_behavior_null_ip_migrated
- opti_behavior_review_installed_at
- opti_behavior_spam_scroll_default_migrated
- optibehavior_indexes_last_checked
Meta Boxes
{
    "post": {
        "optibehavior_editor_analytics": {
            "title": "Post Analytics",
            "context": "normal"
        }
    },
    "page": {
        "optibehavior_editor_analytics": {
            "title": "Post Analytics",
            "context": "normal"
        }
    }
}
PHP Error Log
The log file is empty.