Pixi Image Gallery 1.0.1
Does Pixi Filterable Image Gallery work with WordPress 5.9.2 and PHP 7.4.8? A smoke test was performed on .
Summary
| No PHP errors, warnings or notices | |
| No JavaScript exceptions | |
| All test pages loaded successfully | |
| No resource errors | |
| Looks good! No problems were detected. |
Memory usage: 35.94 KiB
The average PHP memory usage increased by this amount after activating by the plugin.
Page speed impact:
insignificant.
The plugin didn't make the site noticeably slower.
| WordPress version | 5.9.2 |
|---|---|
| PHP version | 7.4.8 |
| MySQL version | 8.0.21 |
| PHP memory limit | 256M |
| Last updated | |
|---|---|
| Active installs | 80+ |
| WordPress.org page | https://wordpress.org/plugins/pixi-image-gallery/ |
| Badges |
|
Pages 5
Plugins ‹ Test site — WordPress
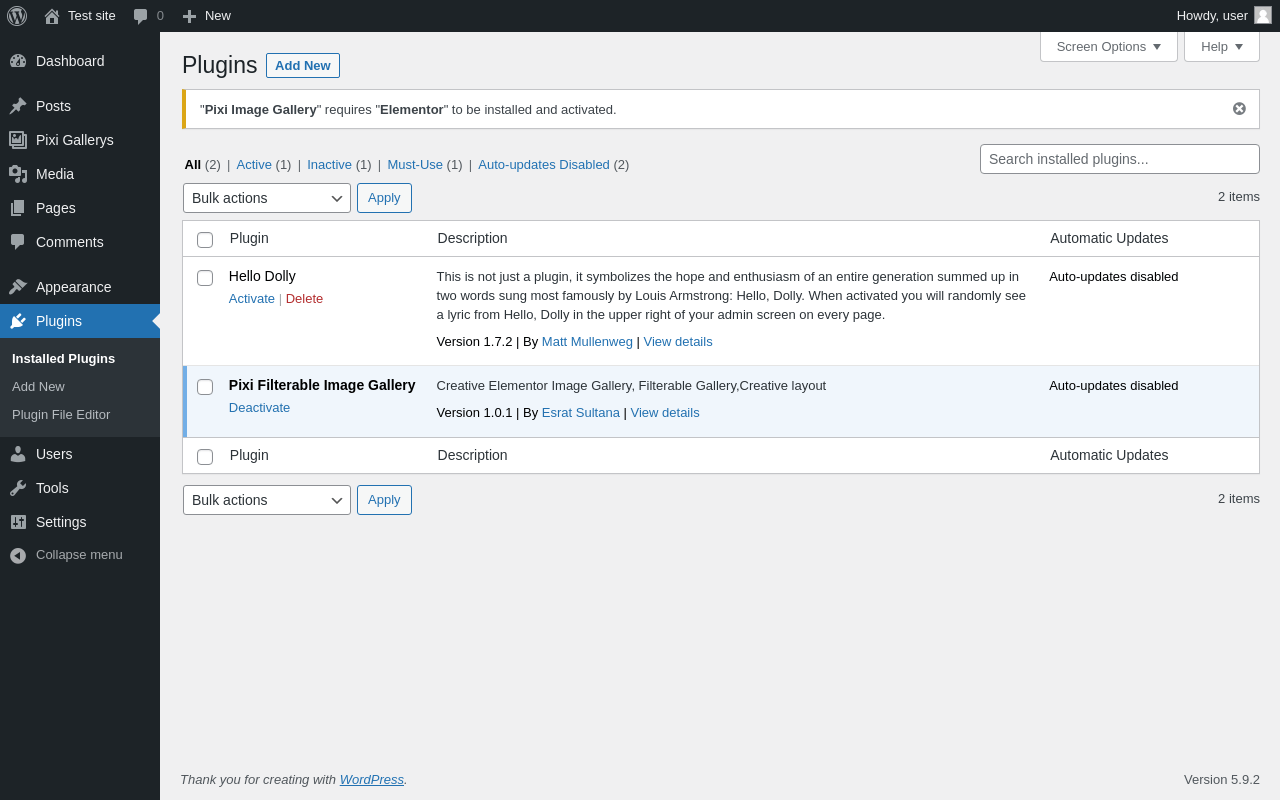
| URL | /wp-admin/plugins.php?plugin_status=all&paged=1&s |
|---|---|
| Requested URL | /wp-admin/plugins.php?action=activate&plugin=pixi-image-gallery%2Fpixi-image-gallery-lite.php&plugin_status=all&paged=1&s&_wpnonce=5c5cdf332b |
| Aspect | after-activation |
| HTTP status | 200 |
| Load time | 0.278 s |
| Memory usage | 3.3 MiB |
| JS errors | None |
| Resource errors | None |
Pixi Gallerys
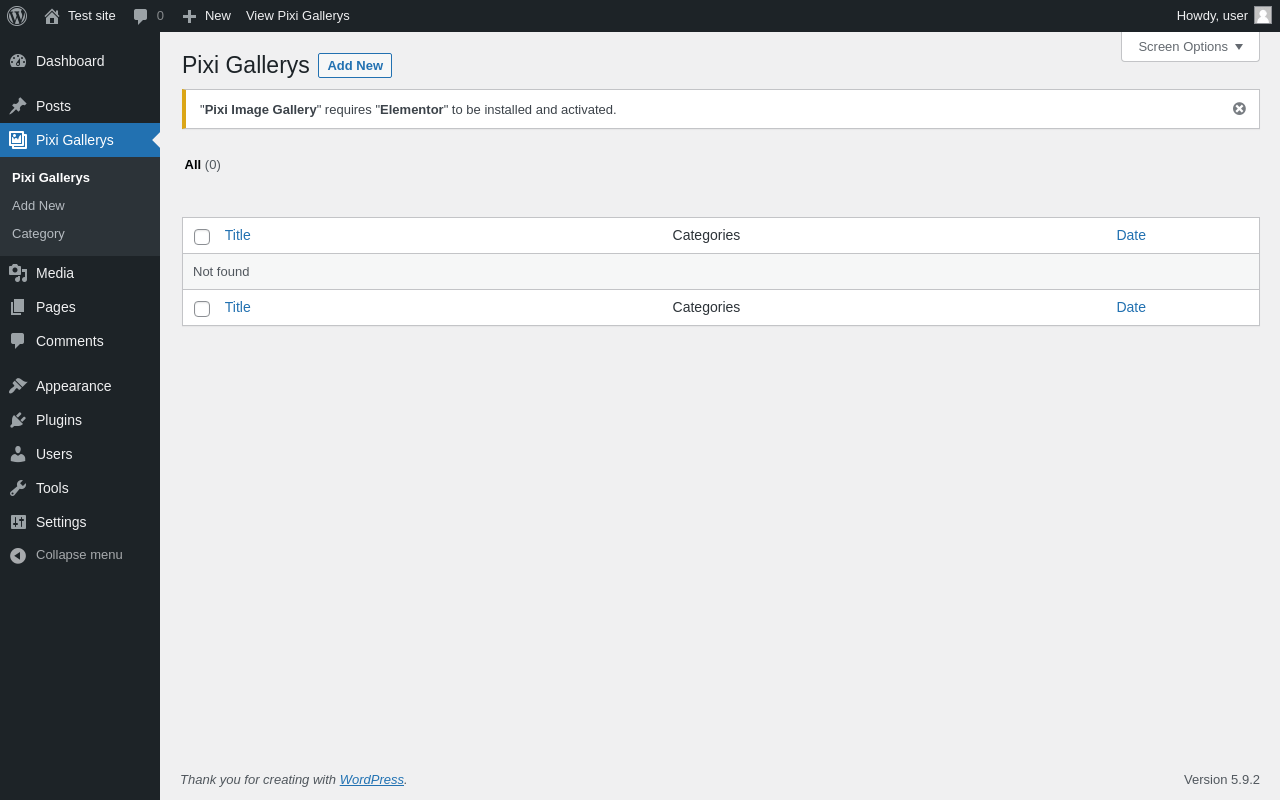
| URL | /wp-admin/edit.php?post_type=pixi_gallery_items |
|---|---|
| Aspect | menu-item |
| HTTP status | 200 |
| Load time | 0.175 s |
| Memory usage | 3.39 MiB |
| JS errors | None |
| Resource errors | None |
Pixi Gallerys → Add New
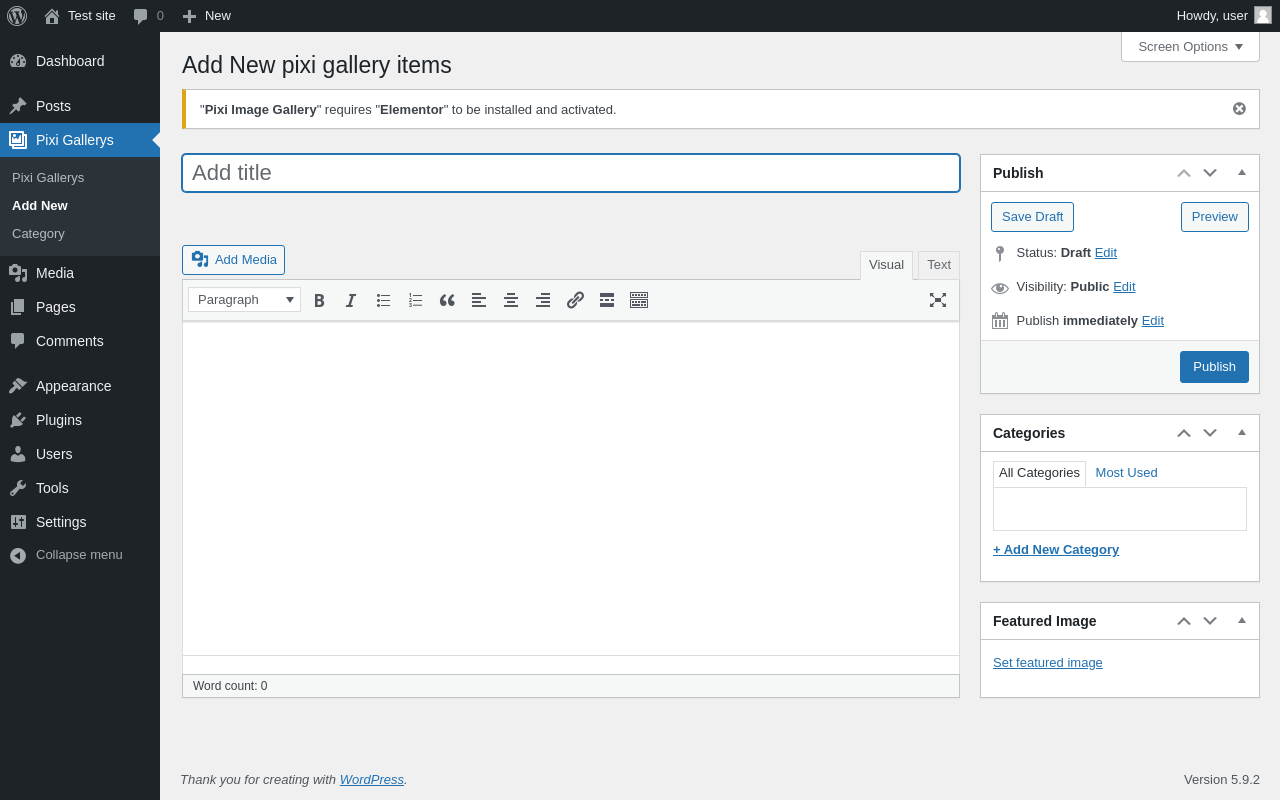
| URL | /wp-admin/post-new.php?post_type=pixi_gallery_items |
|---|---|
| Aspect | menu-item |
| HTTP status | 200 |
| Load time | 1.319 s |
| Memory usage | 3.5 MiB |
| JS errors | None |
| Resource errors | None |
Pixi Gallerys → Category
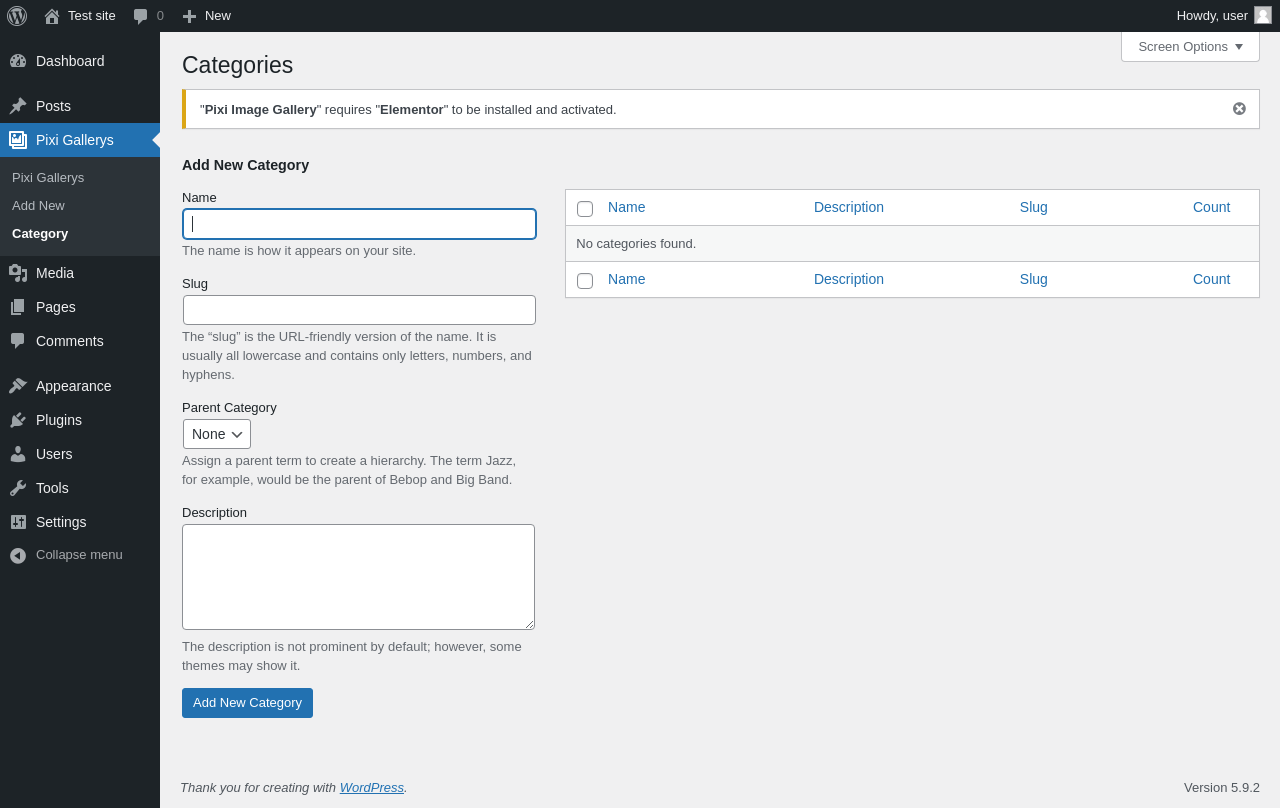
| URL | /wp-admin/edit-tags.php?taxonomy=pixi_gallery_cat&post_type=pixi_gallery_items |
|---|---|
| Aspect | menu-item |
| HTTP status | 200 |
| Load time | 0.204 s |
| Memory usage | 3.29 MiB |
| JS errors | None |
| Resource errors | None |
Test site – Just another WordPress site
| URL | / |
|---|---|
| Aspect | front-page |
| HTTP status | 200 |
| Load time | 0.282 s |
| Memory usage | 3.38 MiB |
| JS errors | None |
| Resource errors | None |
Benchmark
| URL | Load time | Memory usage | ||||
|---|---|---|---|---|---|---|
| Inactive | Active | Change | Inactive | Active | Change | |
| /wp-admin/index.php | 0.351 s | 0.337 s | -0.014 s | 3.37 MiB | 3.4 MiB | + 32.94 KiB |
| /wp-admin/edit.php | 0.179 s | 0.200 s | +0.021 s | 3.4 MiB | 3.43 MiB | + 32.23 KiB |
| /wp-admin/post-new.php | 0.824 s | 0.909 s | +0.085 s | 6.15 MiB | 6.22 MiB | + 71.7 KiB |
| /wp-admin/upload.php | 0.357 s | 0.307 s | -0.050 s | 3.25 MiB | 3.29 MiB | + 39.8 KiB |
| /wp-admin/options-writing.php | 0.275 s | 0.140 s | -0.135 s | 3.24 MiB | 3.27 MiB | + 23.66 KiB |
| /wp-admin/media-new.php | 0.274 s | 0.194 s | -0.080 s | 3.23 MiB | 3.27 MiB | + 39.98 KiB |
| /wp-admin/edit-tags.php?taxonomy=category | 0.186 s | 0.374 s | +0.188 s | 3.27 MiB | 3.3 MiB | + 32.88 KiB |
| /wp-admin/post-new.php?post_type=page | 0.665 s | 0.711 s | +0.046 s | 6.15 MiB | 6.21 MiB | + 67.29 KiB |
| /wp-admin/options-discussion.php | 0.266 s | 0.238 s | -0.028 s | 3.22 MiB | 3.26 MiB | + 40.29 KiB |
| /wp-admin/edit-comments.php | 0.226 s | 0.203 s | -0.023 s | 3.27 MiB | 3.3 MiB | + 31.79 KiB |
| / | 0.301 s | 0.214 s | -0.087 s | 3.4 MiB | 3.38 MiB | - 17.16 KiB |
| Average | 0.355 s | 0.348 s | -0.007 s | 3.81 MiB | 3.85 MiB | + 35.94 KiB |
Code Statistics
Note: Third-party libraries and minified JS/CSS files are excluded from these statistics where possible, so the numbers you see here may be lower than those reported by other tools.
| Language | % | Lines of code | Comment lines | Files | |
|---|---|---|---|---|---|
| PHP | 50.2% | 1,800 | 682 | 14 | |
| SVG | 45.1% | 1,616 | 0 | 1 | |
| CSS | 2.7% | 96 | 1 | 1 | |
| JavaScript | 2.0% | 71 | 24 | 4 | |
| Total | 3,583 | 707 | 20 | ||
PHP Code Analysis | More results »
| Lines of code | 1,792 |
|---|---|
| Total complexity | 91 |
| Median class complexity | 8.0 |
| Median method complexity | 1.0 |
| Most complex class | Pixi_Image_Gallery\Plugin |
| Most complex function | Pixi_Image_Gallery\pixi_image_gallery_filter::register_controls() |
| Classes | 9 |
|---|---|
| Methods | 50 |
| Functions | 7 |
Additions
Things that the plugin adds to the site. This section is not intended to be comprehensive. The test tool only looks for a few specific types of added content.
Custom Post Types 1
| ID | Name |
|---|---|
| pixi_gallery_items | Pixi Gallerys |
PHP Error Log
The log file is empty.