Pixi Image Gallery 1.0.4
Does Pixi Filterable Image Gallery work with WordPress 6.5.3 and PHP 8.1.12? A smoke test was performed on .
Summary
| No PHP errors, warnings or notices | |
| No JavaScript exceptions | |
| All test pages loaded successfully | |
| No resource errors | |
| Looks good! No problems were detected. |
Memory usage: 26.68 KiB
The average PHP memory usage increased by this amount after activating by the plugin.
Page speed impact:
insignificant.
The plugin didn't make the site noticeably slower.
| WordPress version | 6.5.3 |
|---|---|
| PHP version | 8.1.12 |
| MySQL version | 10.6.10 |
| PHP memory limit | 512M |
| Last updated | |
|---|---|
| Active installs | 80+ |
| WordPress.org page | https://wordpress.org/plugins/pixi-image-gallery/ |
| Badges |
|
Pages 5
Plugins ‹ Test site — WordPress
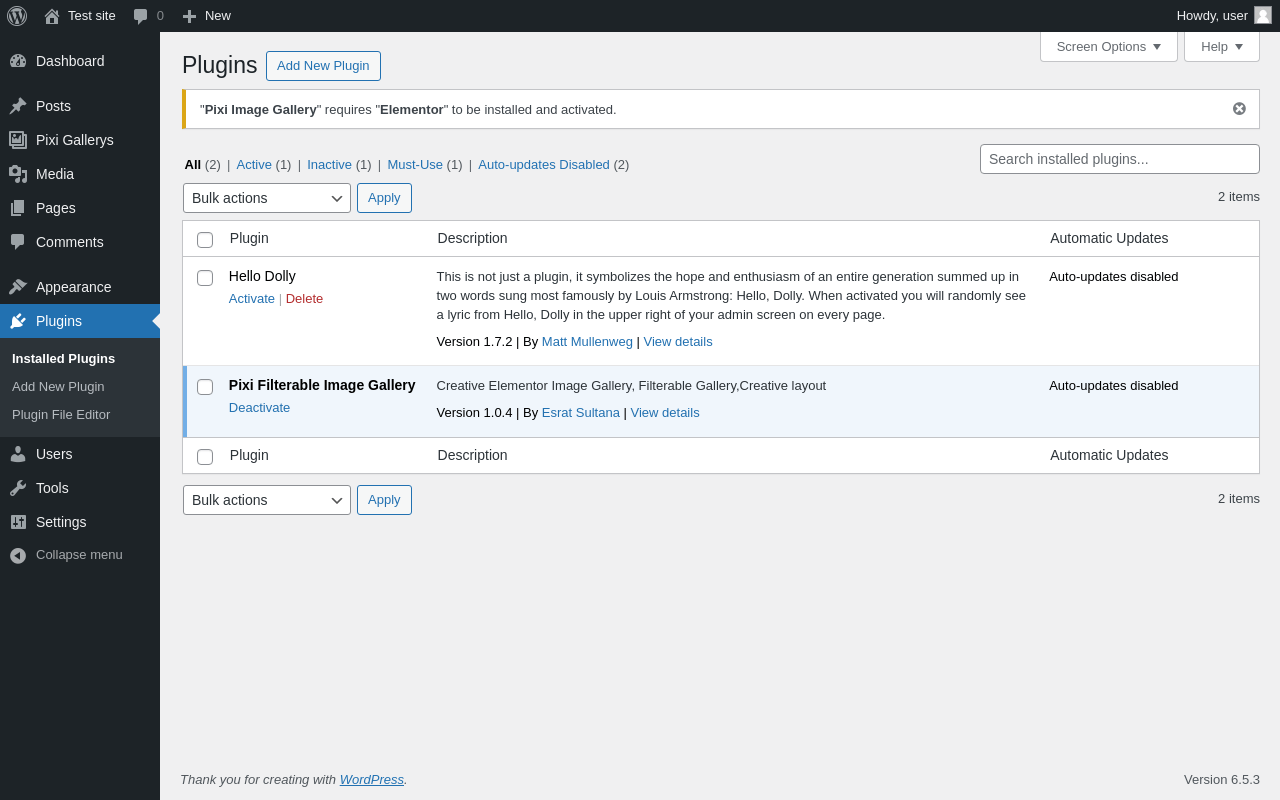
| URL | /wp-admin/plugins.php?plugin_status=all&paged=1&s |
|---|---|
| Requested URL | /wp-admin/plugins.php?action=activate&plugin=pixi-image-gallery%2Fpixi-image-gallery-lite.php&plugin_status=all&paged=1&s&_wpnonce=cb0c369278 |
| Aspect | after-activation |
| HTTP status | 200 |
| Load time | 0.444 s |
| Memory usage | 3.41 MiB |
| JS errors | None |
| Resource errors | None |
Pixi Gallerys
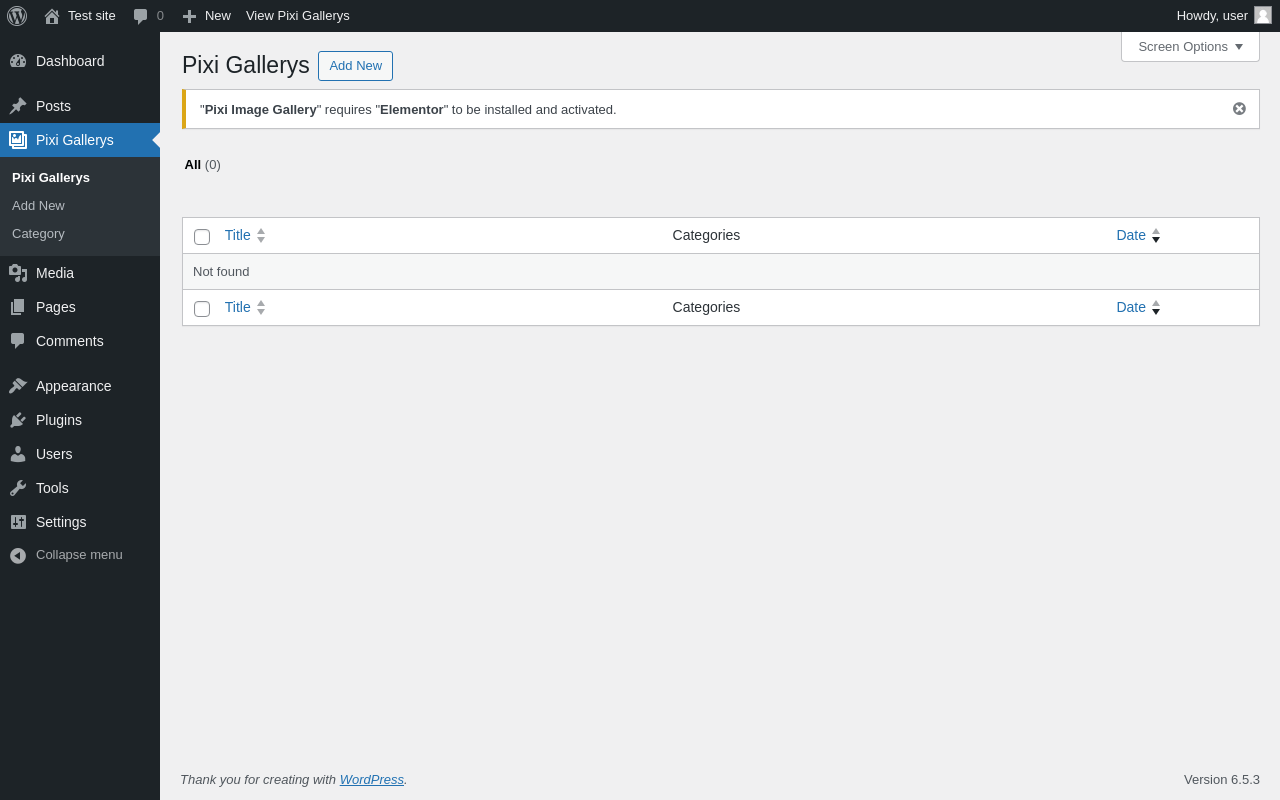
| URL | /wp-admin/edit.php?post_type=pixi_gallery_items |
|---|---|
| Aspect | menu-item |
| HTTP status | 200 |
| Load time | 0.206 s |
| Memory usage | 3.44 MiB |
| JS errors | None |
| Resource errors | None |
Pixi Gallerys → Add New
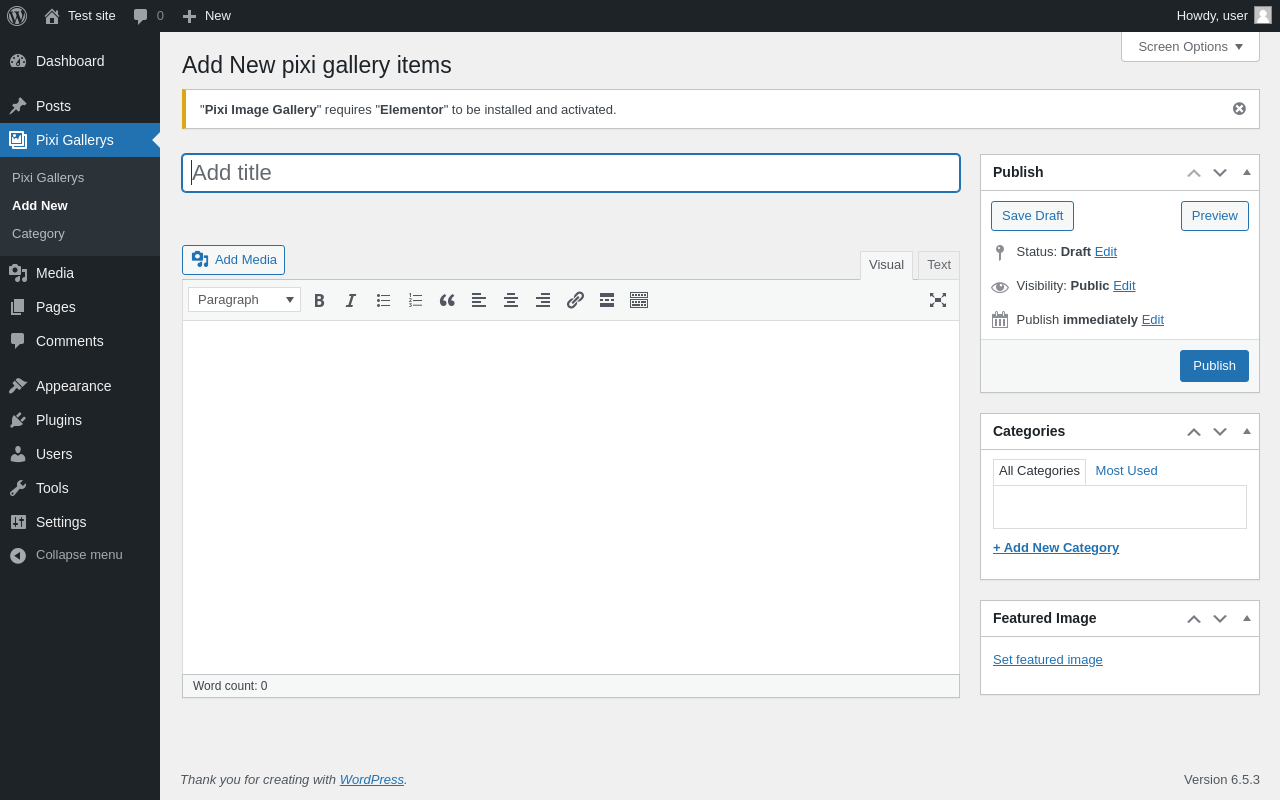
| URL | /wp-admin/post-new.php?post_type=pixi_gallery_items |
|---|---|
| Aspect | menu-item |
| HTTP status | 200 |
| Load time | 0.919 s |
| Memory usage | 3.53 MiB |
| JS errors | None |
| Resource errors | None |
Pixi Gallerys → Category
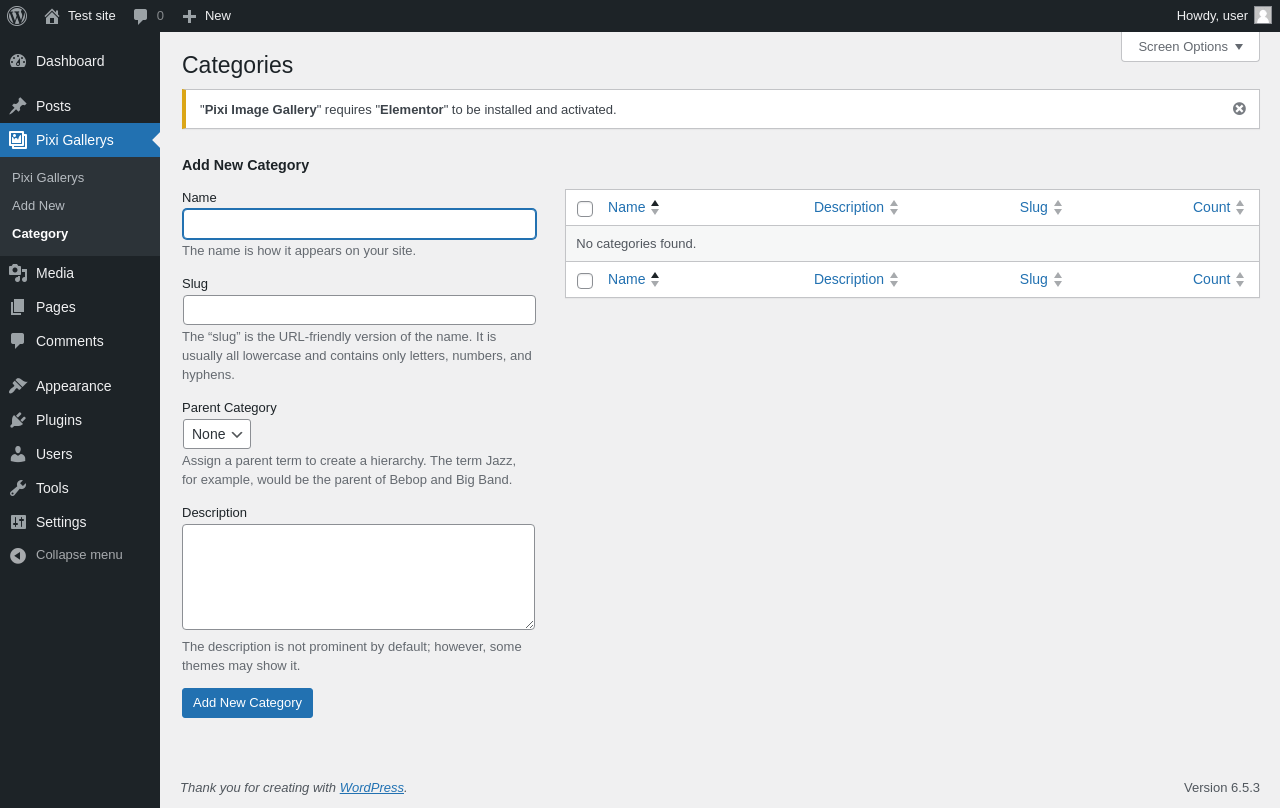
| URL | /wp-admin/edit-tags.php?taxonomy=pixi_gallery_cat&post_type=pixi_gallery_items |
|---|---|
| Aspect | menu-item |
| HTTP status | 200 |
| Load time | 0.209 s |
| Memory usage | 3.39 MiB |
| JS errors | None |
| Resource errors | None |
Test site – Just another WordPress site
| URL | / |
|---|---|
| Aspect | front-page |
| HTTP status | 200 |
| Load time | 0.285 s |
| Memory usage | 3.4 MiB |
| JS errors | None |
| Resource errors | None |
Benchmark
| URL | Load time | Memory usage | ||||
|---|---|---|---|---|---|---|
| Inactive | Active | Change | Inactive | Active | Change | |
| /wp-admin/index.php | 0.388 s | 0.434 s | +0.046 s | 3.44 MiB | 3.47 MiB | + 33.87 KiB |
| /wp-admin/edit.php | 0.273 s | 0.259 s | -0.014 s | 3.46 MiB | 3.49 MiB | + 34.23 KiB |
| /wp-admin/post-new.php | 0.943 s | 0.669 s | -0.274 s | 5.59 MiB | 5.65 MiB | + 65.75 KiB |
| /wp-admin/upload.php | 0.642 s | 0.415 s | -0.227 s | 3.38 MiB | 3.4 MiB | + 16.83 KiB |
| /wp-admin/options-writing.php | 0.211 s | 0.200 s | -0.011 s | 3.37 MiB | 3.38 MiB | + 8.79 KiB |
| /wp-admin/media-new.php | 0.291 s | 0.255 s | -0.036 s | 3.35 MiB | 3.38 MiB | + 29.02 KiB |
| /wp-admin/edit-tags.php?taxonomy=category | 0.190 s | 0.194 s | +0.004 s | 3.37 MiB | 3.4 MiB | + 34.19 KiB |
| /wp-admin/post-new.php?post_type=page | 0.563 s | 0.622 s | +0.059 s | 5.59 MiB | 5.64 MiB | + 57.34 KiB |
| /wp-admin/options-discussion.php | 0.385 s | 0.326 s | -0.059 s | 3.36 MiB | 3.38 MiB | + 17.32 KiB |
| /wp-admin/edit-comments.php | 0.313 s | 0.262 s | -0.051 s | 3.39 MiB | 3.41 MiB | + 16.82 KiB |
| / | 0.353 s | 0.220 s | -0.133 s | 3.42 MiB | 3.4 MiB | - 20.64 KiB |
| Average | 0.414 s | 0.351 s | -0.063 s | 3.79 MiB | 3.82 MiB | + 26.68 KiB |
Code Statistics
Note: Third-party libraries and minified JS/CSS files are excluded from these statistics where possible, so the numbers you see here may be lower than those reported by other tools.
| Language | % | Lines of code | Comment lines | Files | |
|---|---|---|---|---|---|
| PHP | 52.3% | 2,037 | 684 | 14 | |
| SVG | 41.5% | 1,616 | 0 | 1 | |
| CSS | 4.4% | 171 | 3 | 1 | |
| JavaScript | 1.8% | 69 | 24 | 4 | |
| Total | 3,893 | 711 | 20 | ||
PHP Code Analysis | More results »
| Lines of code | 2,030 |
|---|---|
| Total complexity | 93 |
| Median class complexity | 8.0 |
| Median method complexity | 1.0 |
| Most complex class | Pixi_Image_Gallery\Plugin |
| Most complex function | Pixi_Image_Gallery\pixi_image_gallery_filter::register_controls() |
| Classes | 9 |
|---|---|
| Methods | 50 |
| Functions | 7 |
Additions
Things that the plugin adds to the site. This section is not intended to be comprehensive. The test tool only looks for a few specific types of added content.
Custom Post Types 1
| ID | Name |
|---|---|
| pixi_gallery_items | Pixi Gallerys |
PHP Error Log
The log file is empty.