RuntimeGuard 1.0.0
Does RuntimeGuard work with WordPress 6.9.4 and PHP 8.1.12? A smoke test was performed on .
Summary
| No PHP errors, warnings or notices | |
| No JavaScript exceptions | |
| All test pages loaded successfully | |
| No resource errors | |
| Looks good! No problems were detected. |
Memory usage: 105.12 KiB
The average PHP memory usage increased by this amount after activating by the plugin.
Page speed impact:
insignificant.
The plugin didn't make the site noticeably slower.
| WordPress version | 6.9.4 |
|---|---|
| PHP version | 8.1.12 |
| MySQL version | 10.6.10 |
| PHP memory limit | 512M |
| Last updated | |
|---|---|
| Active installs | <10 |
| WordPress.org page | https://wordpress.org/plugins/runtimeguard/ |
| Badges |
|
Pages 5
Plugins ‹ Test site — WordPress
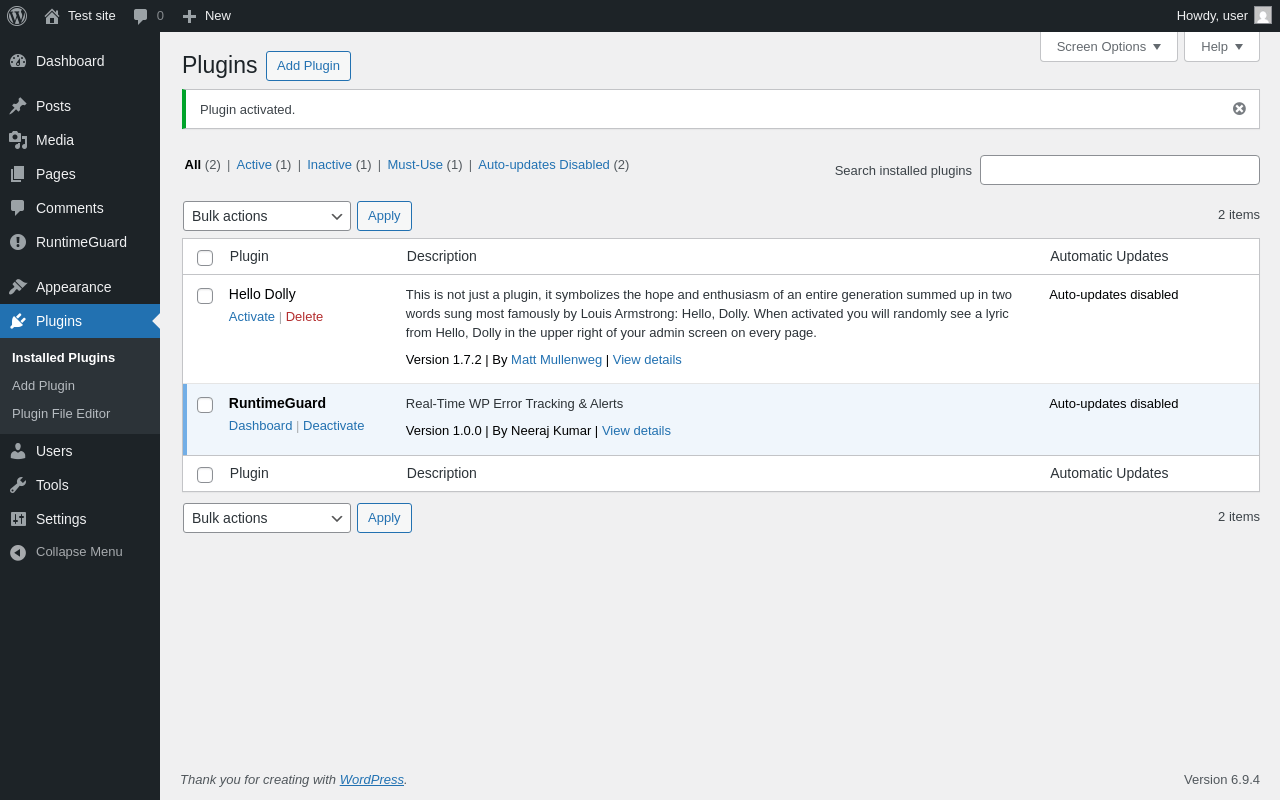
| URL | /wp-admin/plugins.php?plugin_status=all&paged=1&s |
|---|---|
| Requested URL | /wp-admin/plugins.php?action=activate&plugin=runtimeguard%2Fruntimeguard.php&plugin_status=all&paged=1&s&_wpnonce=ab750001a9 |
| Aspect | after-activation |
| HTTP status | 200 |
| Load time | 0.525 s |
| Memory usage | 3.84 MiB |
| JS errors | None |
| Resource errors | None |
RuntimeGuard
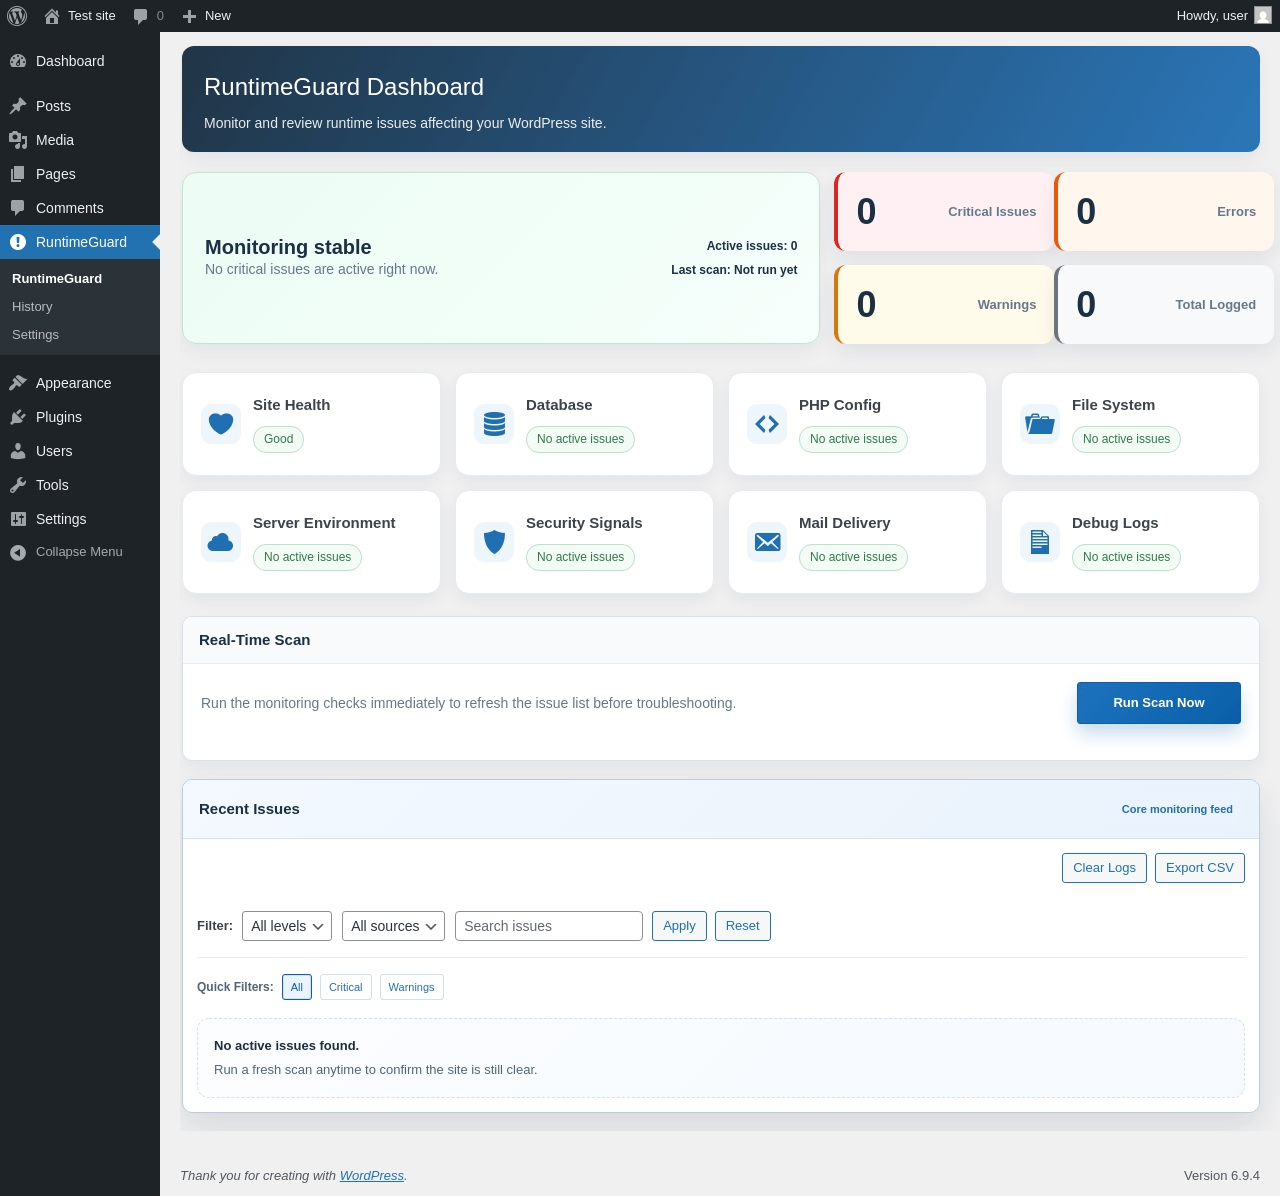
| URL | /wp-admin/admin.php?page=runtimeguard |
|---|---|
| Aspect | menu-item |
| HTTP status | 200 |
| Load time | 0.368 s |
| Memory usage | 3.92 MiB |
| JS errors | None |
| Resource errors | None |
RuntimeGuard → History
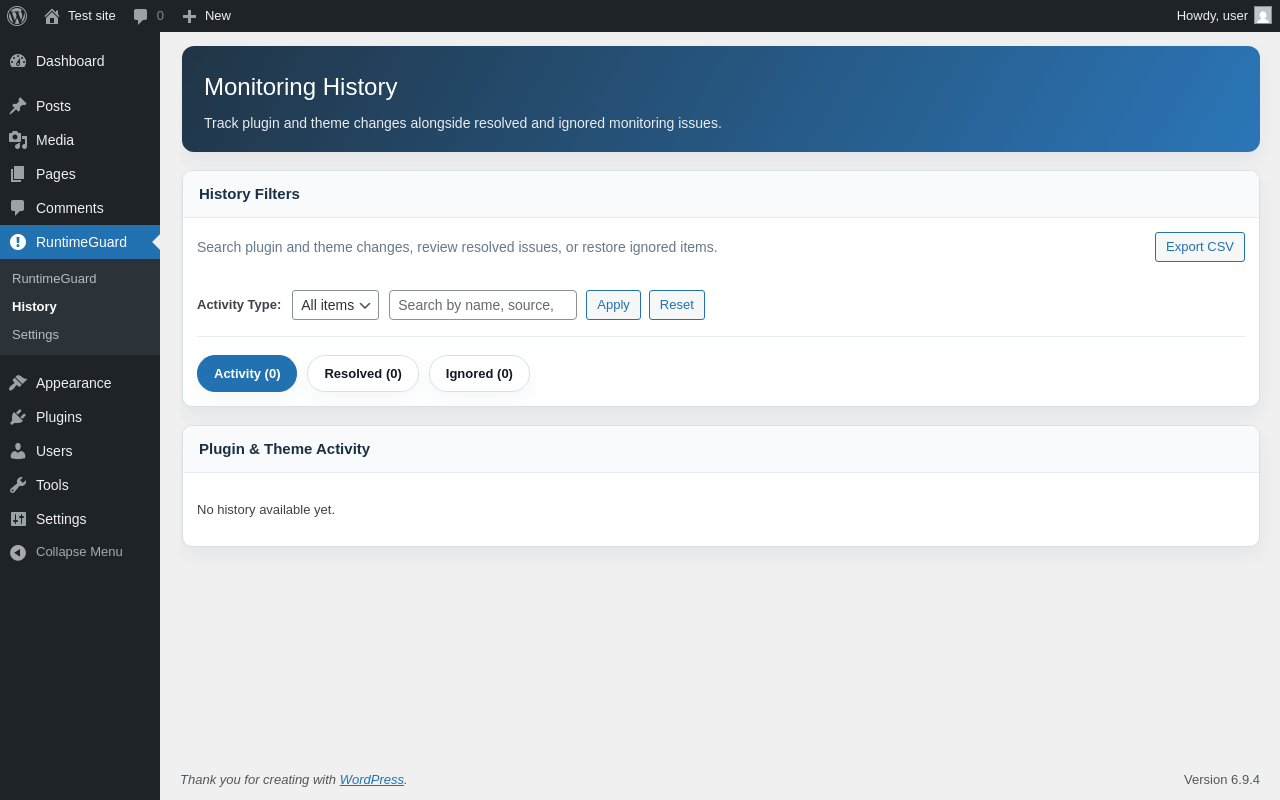
| URL | /wp-admin/admin.php?page=runtimeguard-history |
|---|---|
| Aspect | menu-item |
| HTTP status | 200 |
| Load time | 0.298 s |
| Memory usage | 3.9 MiB |
| JS errors | None |
| Resource errors | None |
RuntimeGuard → Settings
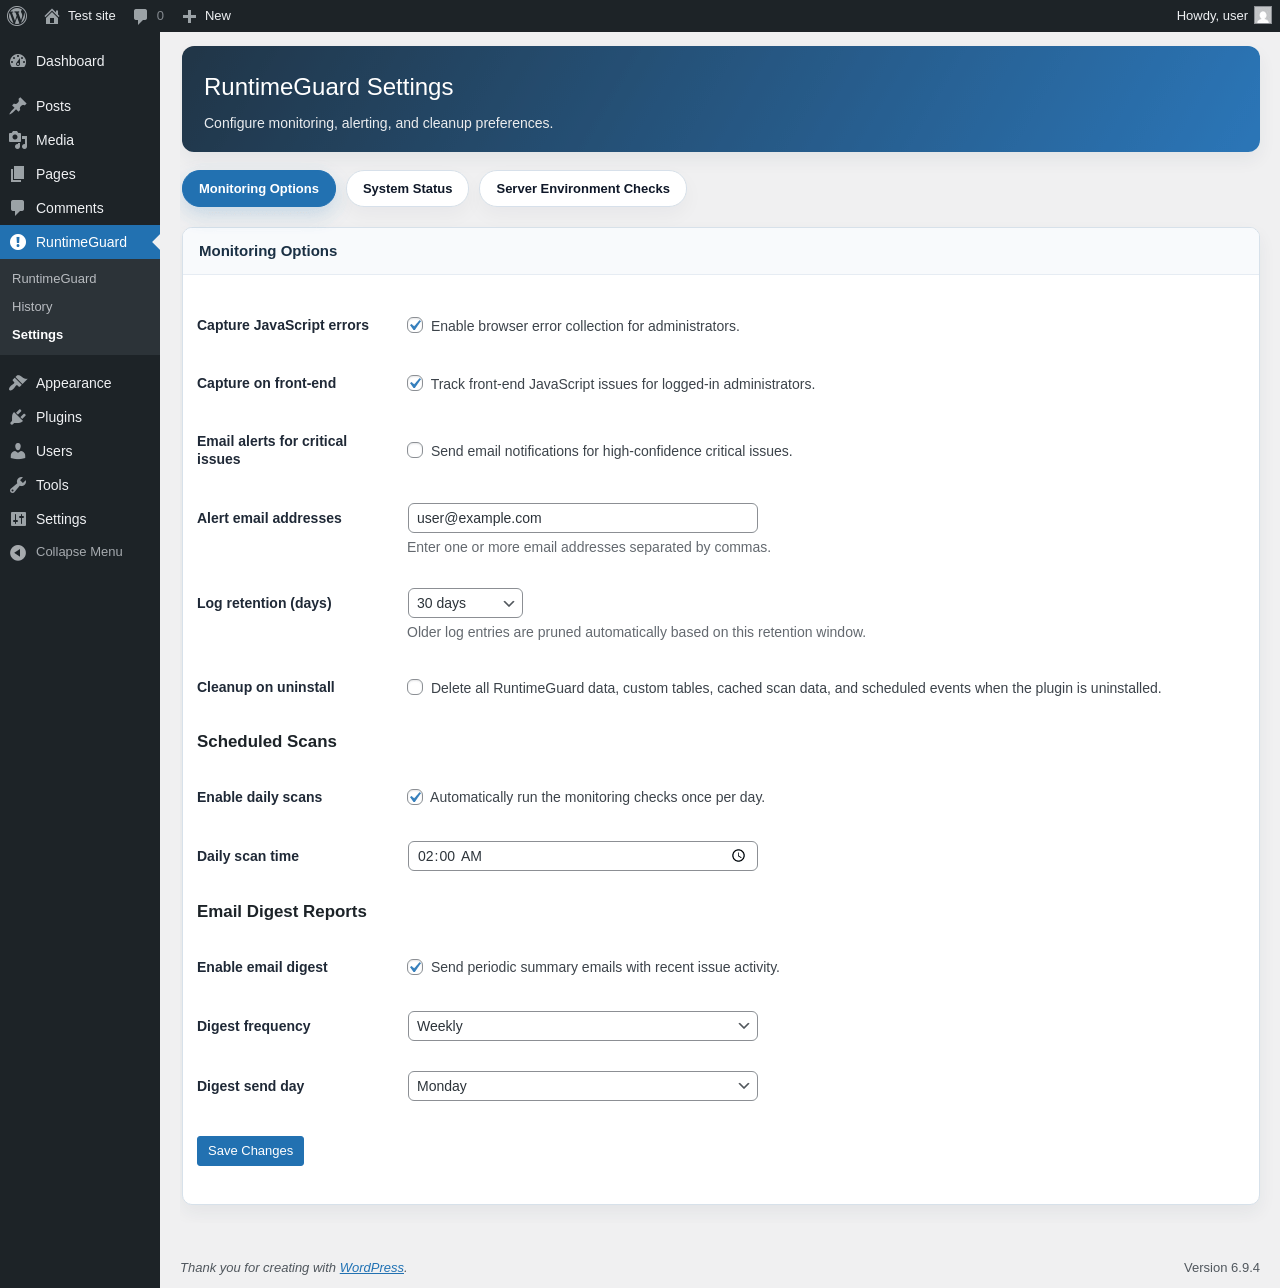
| URL | /wp-admin/admin.php?page=runtimeguard-settings |
|---|---|
| Aspect | menu-item |
| HTTP status | 200 |
| Load time | 0.447 s |
| Memory usage | 3.81 MiB |
| JS errors | None |
| Resource errors | None |
Test site – Just another WordPress site
| URL | / |
|---|---|
| Aspect | front-page |
| HTTP status | 200 |
| Load time | 0.260 s |
| Memory usage | 4.2 MiB |
| JS errors | None |
| Resource errors | None |
Benchmark
| URL | Load time | Memory usage | ||||
|---|---|---|---|---|---|---|
| Inactive | Active | Change | Inactive | Active | Change | |
| /wp-admin/index.php | 0.427 s | 0.358 s | -0.069 s | 3.78 MiB | 3.89 MiB | + 108.37 KiB |
| /wp-admin/edit.php | 0.361 s | 0.421 s | +0.060 s | 3.79 MiB | 3.89 MiB | + 108.23 KiB |
| /wp-admin/post-new.php | 0.854 s | 0.882 s | +0.028 s | 6.31 MiB | 6.45 MiB | + 142.19 KiB |
| /wp-admin/upload.php | 0.689 s | 0.441 s | -0.248 s | 3.74 MiB | 3.83 MiB | + 90.83 KiB |
| /wp-admin/options-writing.php | 0.329 s | 0.299 s | -0.030 s | 3.72 MiB | 3.81 MiB | + 95.13 KiB |
| /wp-admin/media-new.php | 0.496 s | 0.319 s | -0.177 s | 3.71 MiB | 3.81 MiB | + 103.33 KiB |
| /wp-admin/edit-tags.php?taxonomy=category | 0.426 s | 0.296 s | -0.130 s | 3.72 MiB | 3.83 MiB | + 113.69 KiB |
| /wp-admin/post-new.php?post_type=page | 0.693 s | 0.711 s | +0.018 s | 6.3 MiB | 6.44 MiB | + 138.74 KiB |
| /wp-admin/options-discussion.php | 0.331 s | 0.402 s | +0.071 s | 3.72 MiB | 3.81 MiB | + 91.32 KiB |
| /wp-admin/edit-comments.php | 0.316 s | 0.301 s | -0.015 s | 3.74 MiB | 3.83 MiB | + 91.13 KiB |
| / | 0.265 s | 0.183 s | -0.082 s | 4.12 MiB | 4.2 MiB | + 73.39 KiB |
| Average | 0.472 s | 0.419 s | -0.052 s | 4.24 MiB | 4.34 MiB | + 105.12 KiB |
Code Statistics
Note: Third-party libraries and minified JS/CSS files are excluded from these statistics where possible, so the numbers you see here may be lower than those reported by other tools.
| Language | % | Lines of code | Comment lines | Files | |
|---|---|---|---|---|---|
| PHP | 69.5% | 5,245 | 67 | 7 | |
| CSS | 21.4% | 1,613 | 1 | 2 | |
| JavaScript | 9.1% | 685 | 1 | 2 | |
| Total | 7,543 | 69 | 11 | ||
PHP Code Analysis | More results »
| Lines of code | 4,492 |
|---|---|
| Total complexity | 860 |
| Median class complexity | 847.0 |
| Median method complexity | 4.0 |
| Most complex class | RuntimeGuard |
| Most complex function | RuntimeGuard::check_server_environment() |
| Classes | 1 |
|---|---|
| Methods | 163 |
| Functions | 5 |
Additions
Things that the plugin adds to the site. This section is not intended to be comprehensive. The test tool only looks for a few specific types of added content.
Database Tables 4
- wp_runtimeguard_history
- wp_runtimeguard_logs
- wp_runtimeguard_resolved_issues
- wp_runtimeguard_security_cache
Options wp_options 4
- runtimeguard_db_version
- runtimeguard_plugin_history
- runtimeguard_plugin_state
- runtimeguard_settings
PHP Error Log
The log file is empty.