Speed Optimizer 7.7.11
Does Speed Optimizer work with WordPress 7.0 and PHP 8.1.12? A smoke test was performed on .
Summary
| No PHP errors, warnings or notices | |
| No JavaScript exceptions | |
| All test pages loaded successfully | |
| No resource errors | |
| Looks good! No problems were detected. |
Memory usage: 261.53 KiB
The average PHP memory usage increased by this amount after activating by the plugin.
Page speed impact:
0.022 seconds
The average page load time increased by this amount after activating the plugin.
| WordPress version | 7.0 |
|---|---|
| PHP version | 8.1.12 |
| MySQL version | 10.6.10 |
| PHP memory limit | 512M |
| Last updated | |
|---|---|
| Active installs | 1,000,000+ |
| WordPress.org page | https://wordpress.org/plugins/sg-cachepress/ |
| Badges |
|
Pages 9
Plugins ‹ Test site — WordPress
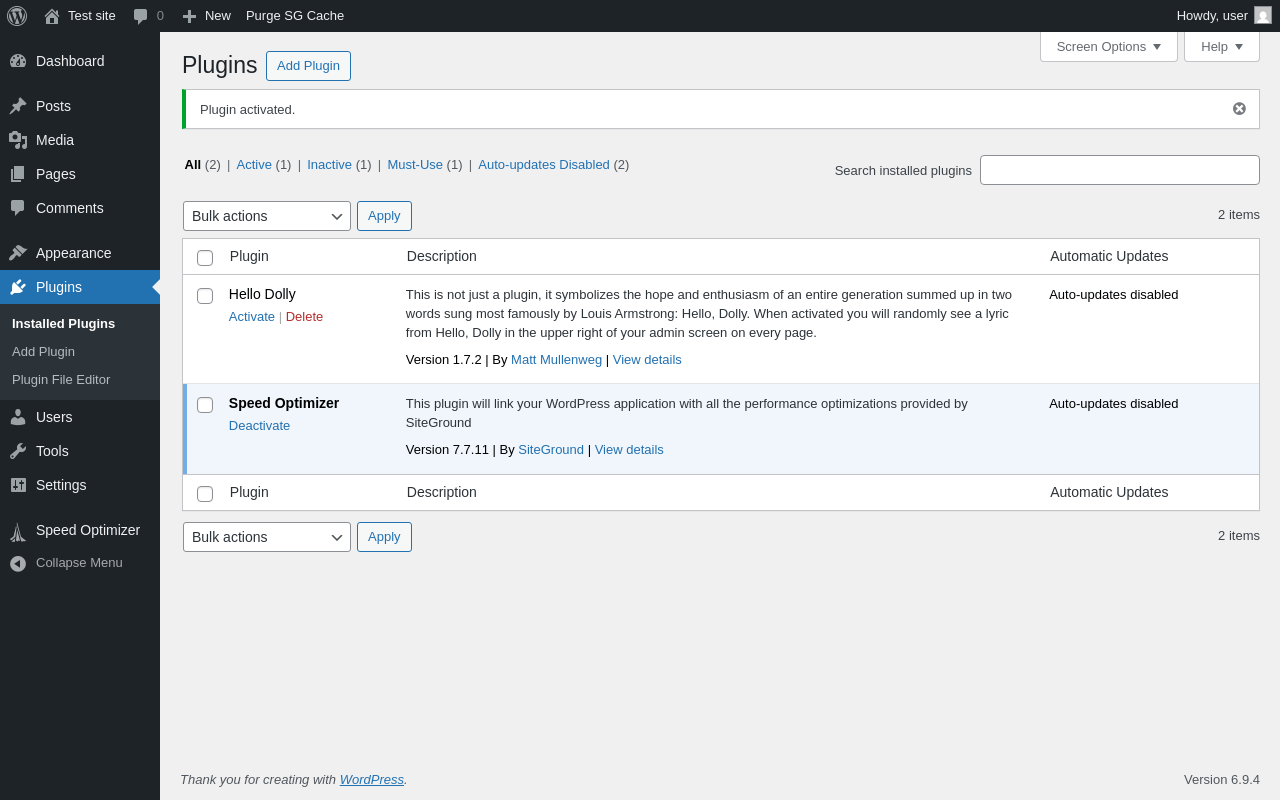
| URL | /wp-admin/plugins.php?plugin_status=all&paged=1&s |
|---|---|
| Requested URL | /wp-admin/plugins.php?action=activate&plugin=sg-cachepress%2Fsg-cachepress.php&plugin_status=all&paged=1&s&_wpnonce=e56de82819 |
| Aspect | after-activation |
| HTTP status | 200 |
| Load time | 1.264 s |
| Memory usage | 4.08 MiB |
| JS errors | None |
| Resource errors | None |
Settings → SG Plugins
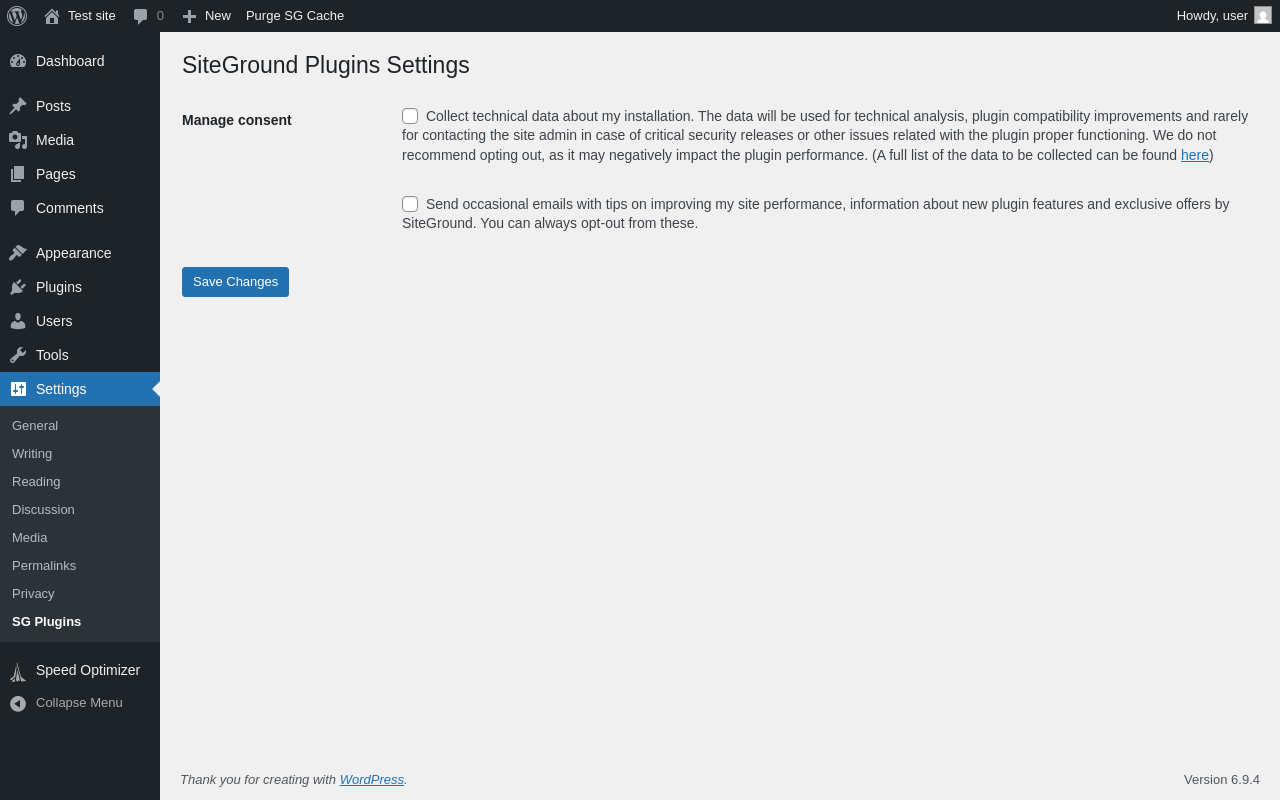
| URL | /wp-admin/options-general.php?page=siteground_settings |
|---|---|
| Aspect | menu-item |
| HTTP status | 200 |
| Load time | 0.492 s |
| Memory usage | 4.06 MiB |
| JS errors | None |
| Resource errors | None |
Speed Optimizer
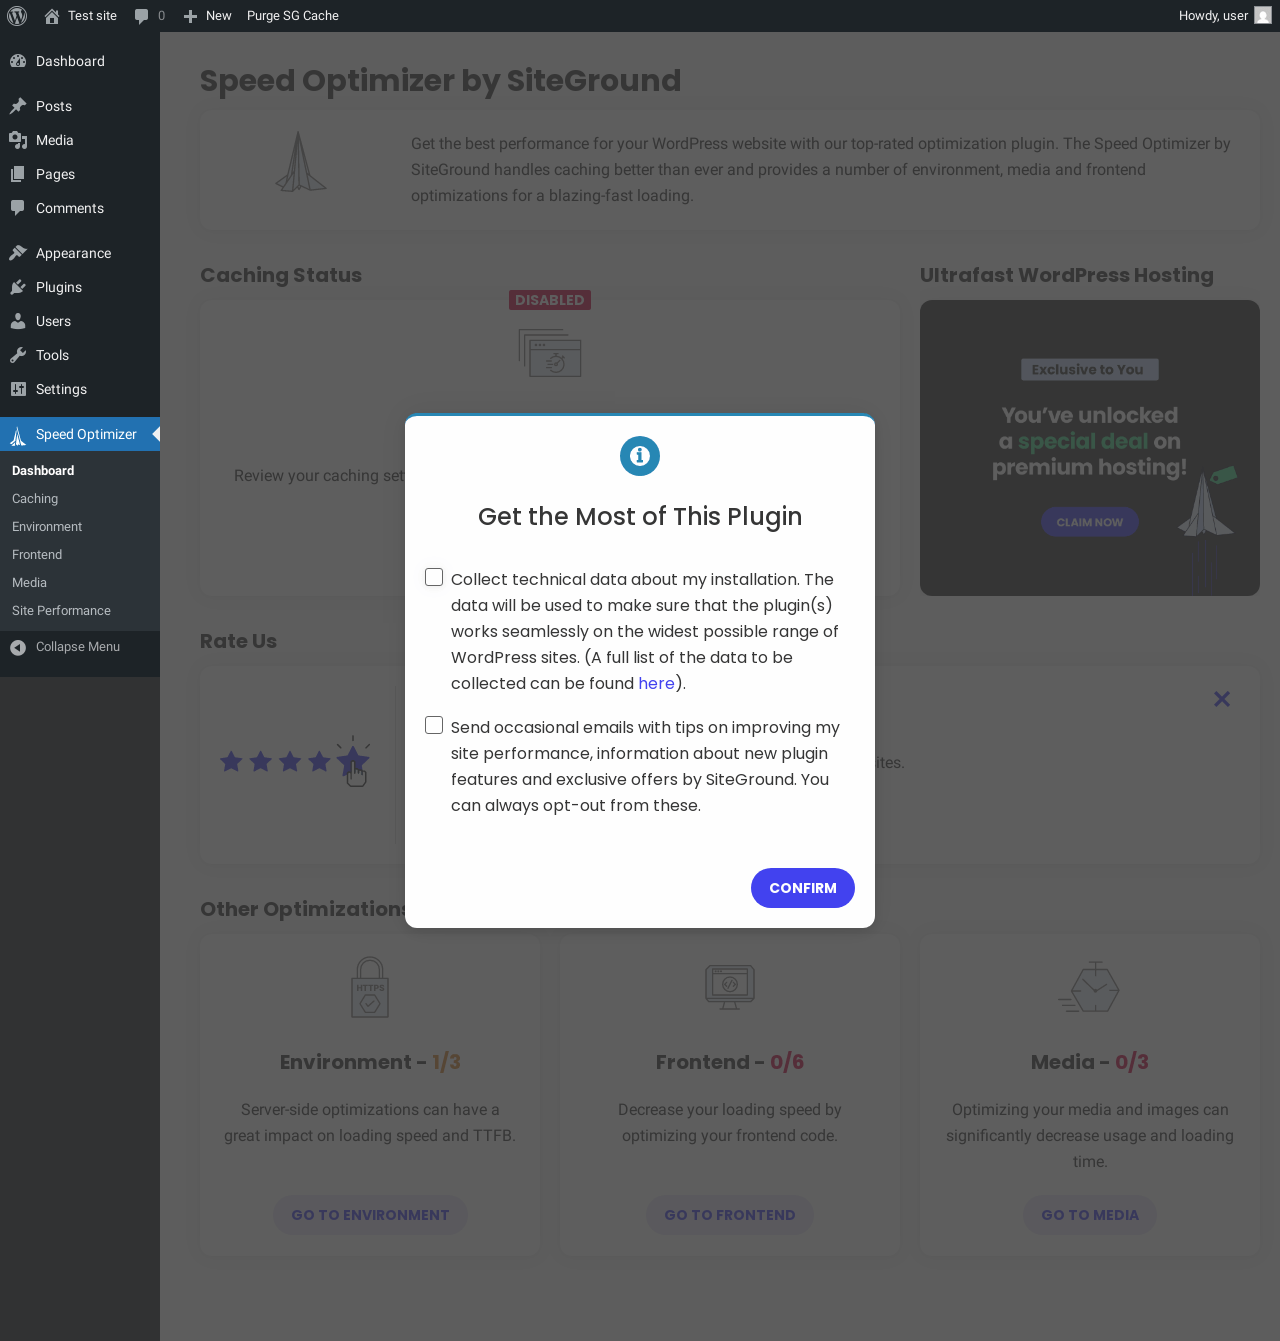
| URL | /wp-admin/admin.php?page=sg-cachepress |
|---|---|
| Aspect | menu-item |
| HTTP status | 200 |
| Load time | 1.079 s |
| Memory usage | 4.06 MiB |
| JS errors | None |
| Resource errors | None |
Speed Optimizer → Caching
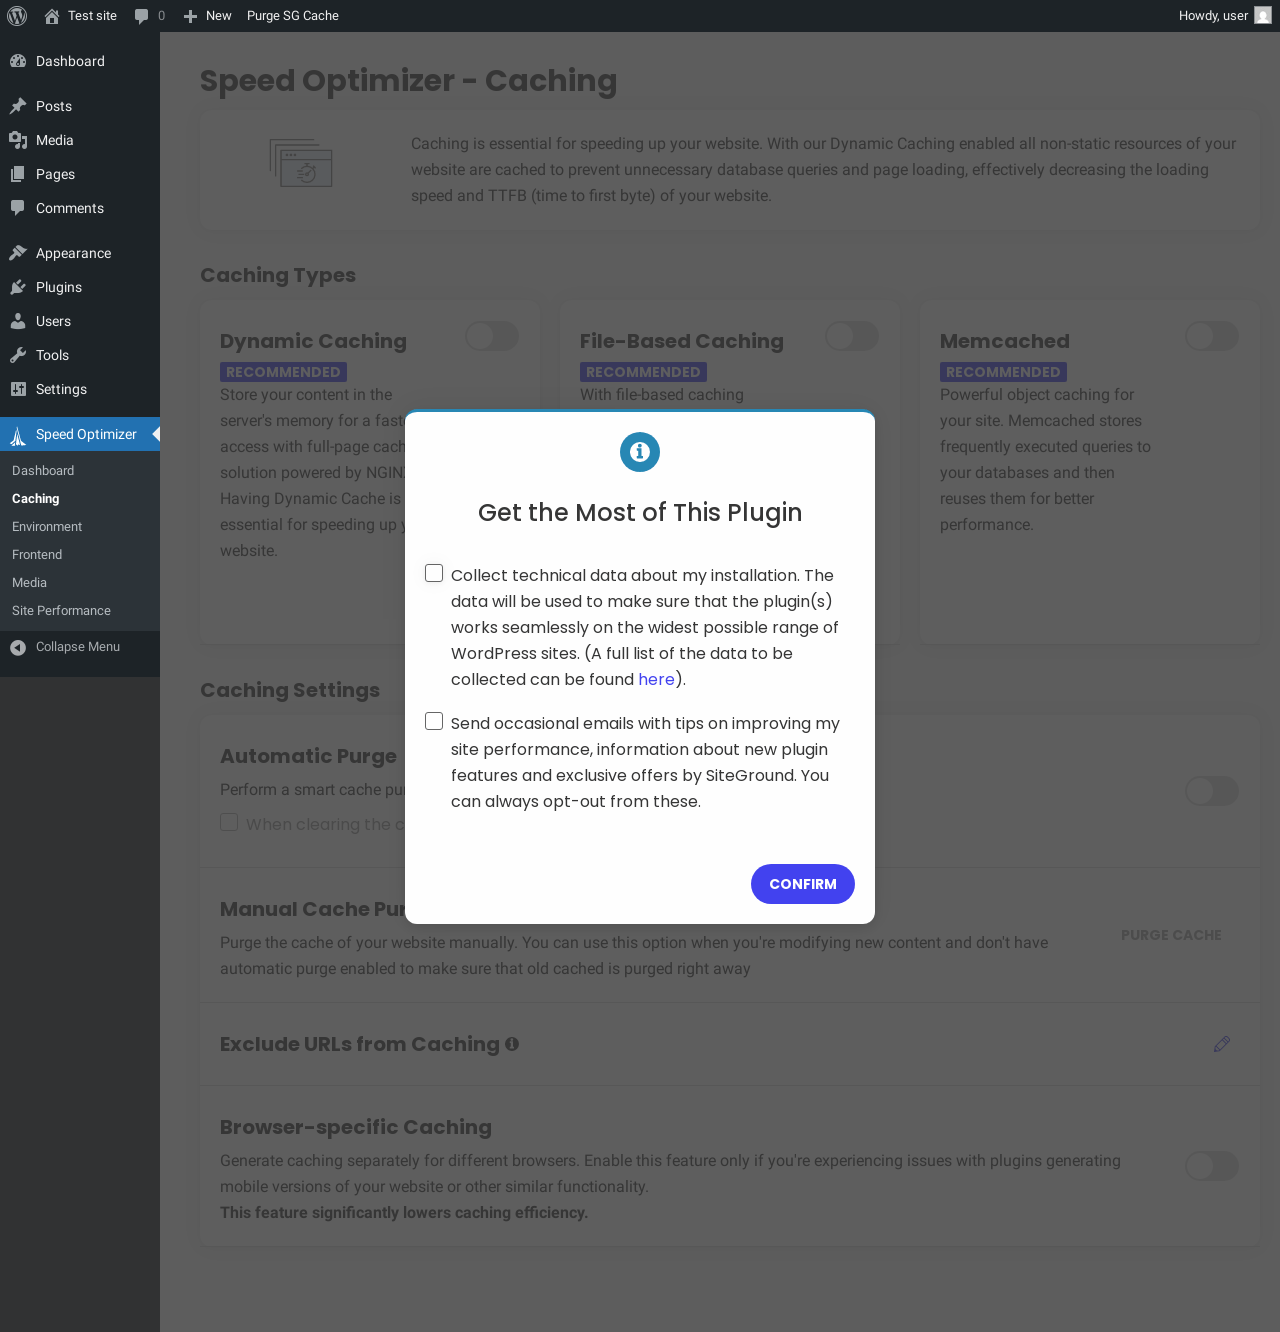
| URL | /wp-admin/admin.php?page=sgo_caching |
|---|---|
| Aspect | menu-item |
| HTTP status | 200 |
| Load time | 1.077 s |
| Memory usage | 4.04 MiB |
| JS errors | None |
| Resource errors | None |
Speed Optimizer → Environment
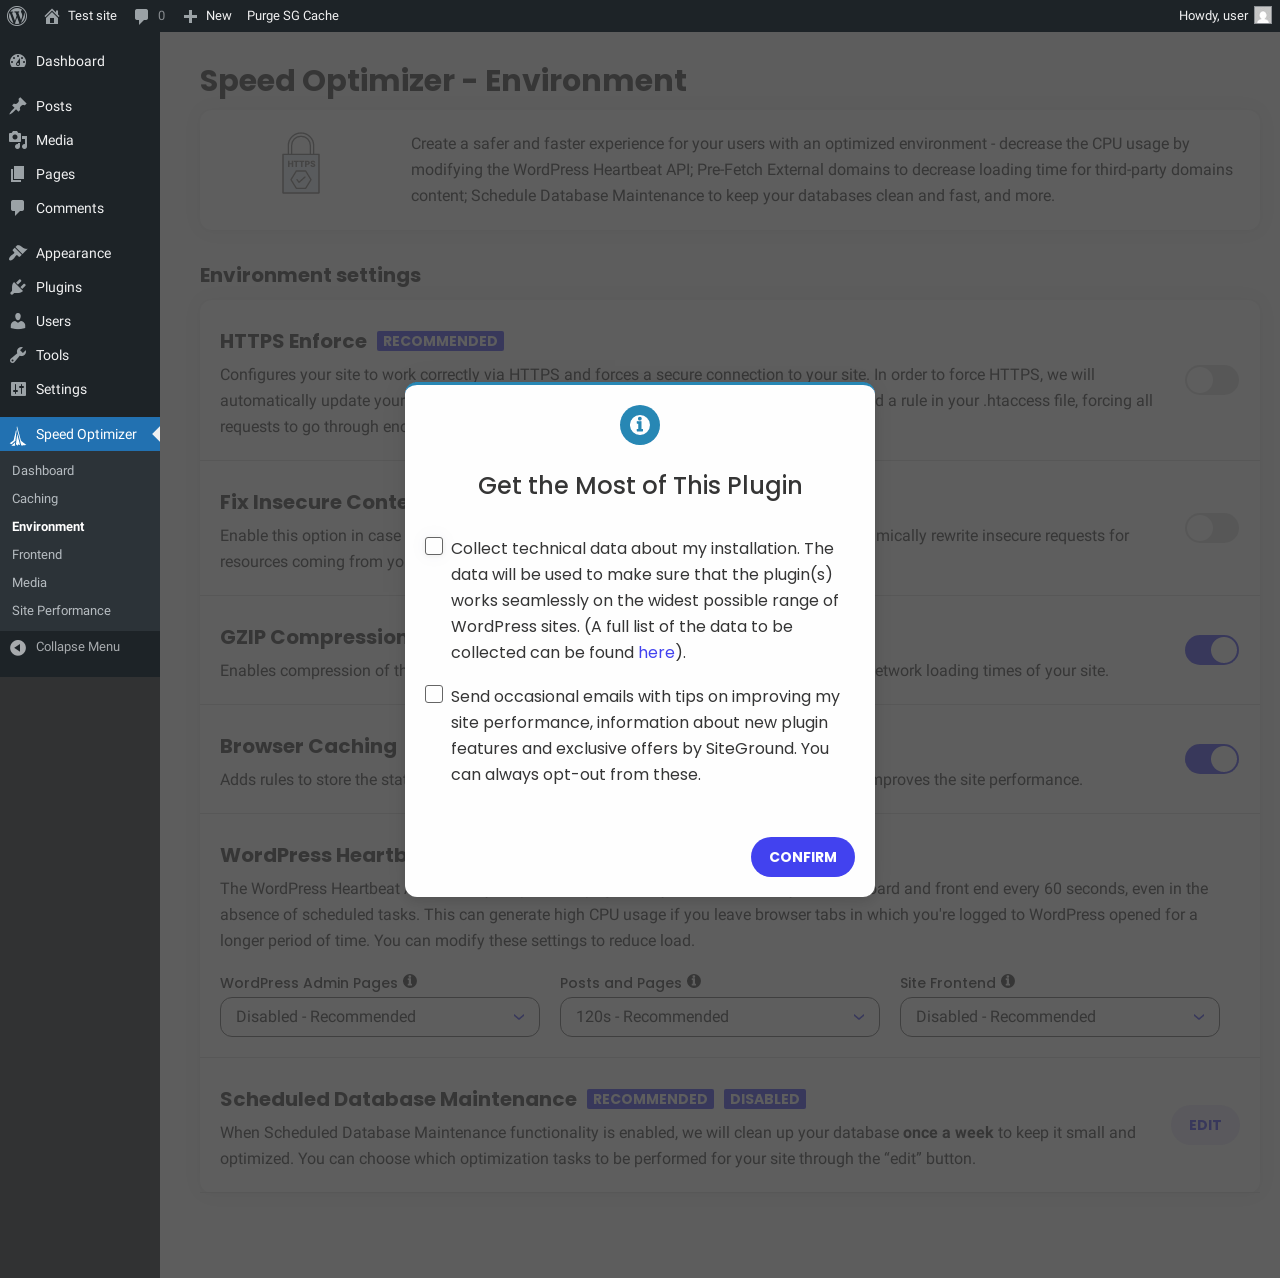
| URL | /wp-admin/admin.php?page=sgo_environment |
|---|---|
| Aspect | menu-item |
| HTTP status | 200 |
| Load time | 0.801 s |
| Memory usage | 4.04 MiB |
| JS errors | None |
| Resource errors | None |
Speed Optimizer → Frontend
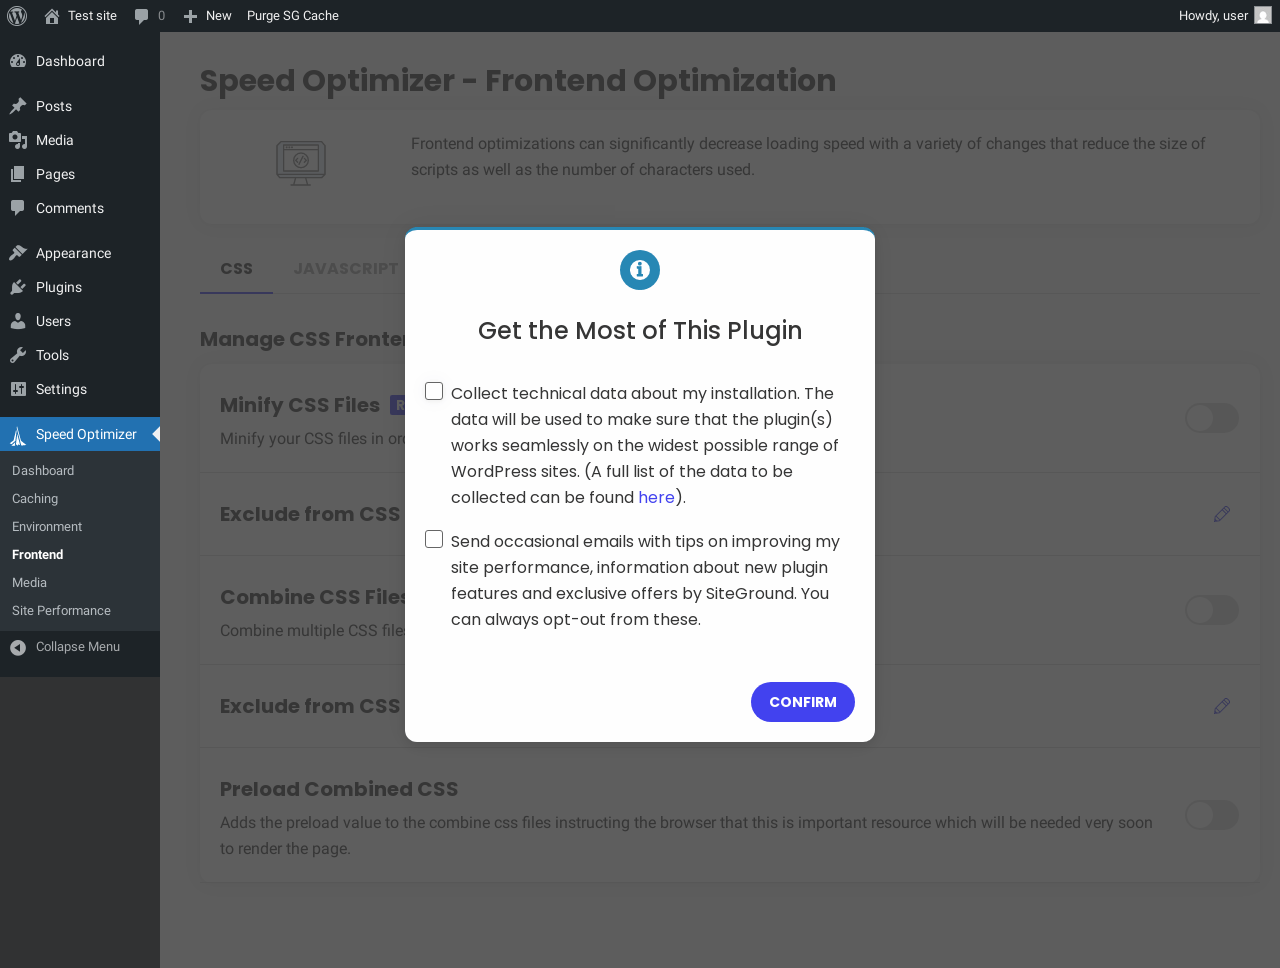
| URL | /wp-admin/admin.php?page=sgo_frontend |
|---|---|
| Aspect | menu-item |
| HTTP status | 200 |
| Load time | 0.796 s |
| Memory usage | 4.04 MiB |
| JS errors | None |
| Resource errors | None |
Speed Optimizer → Media
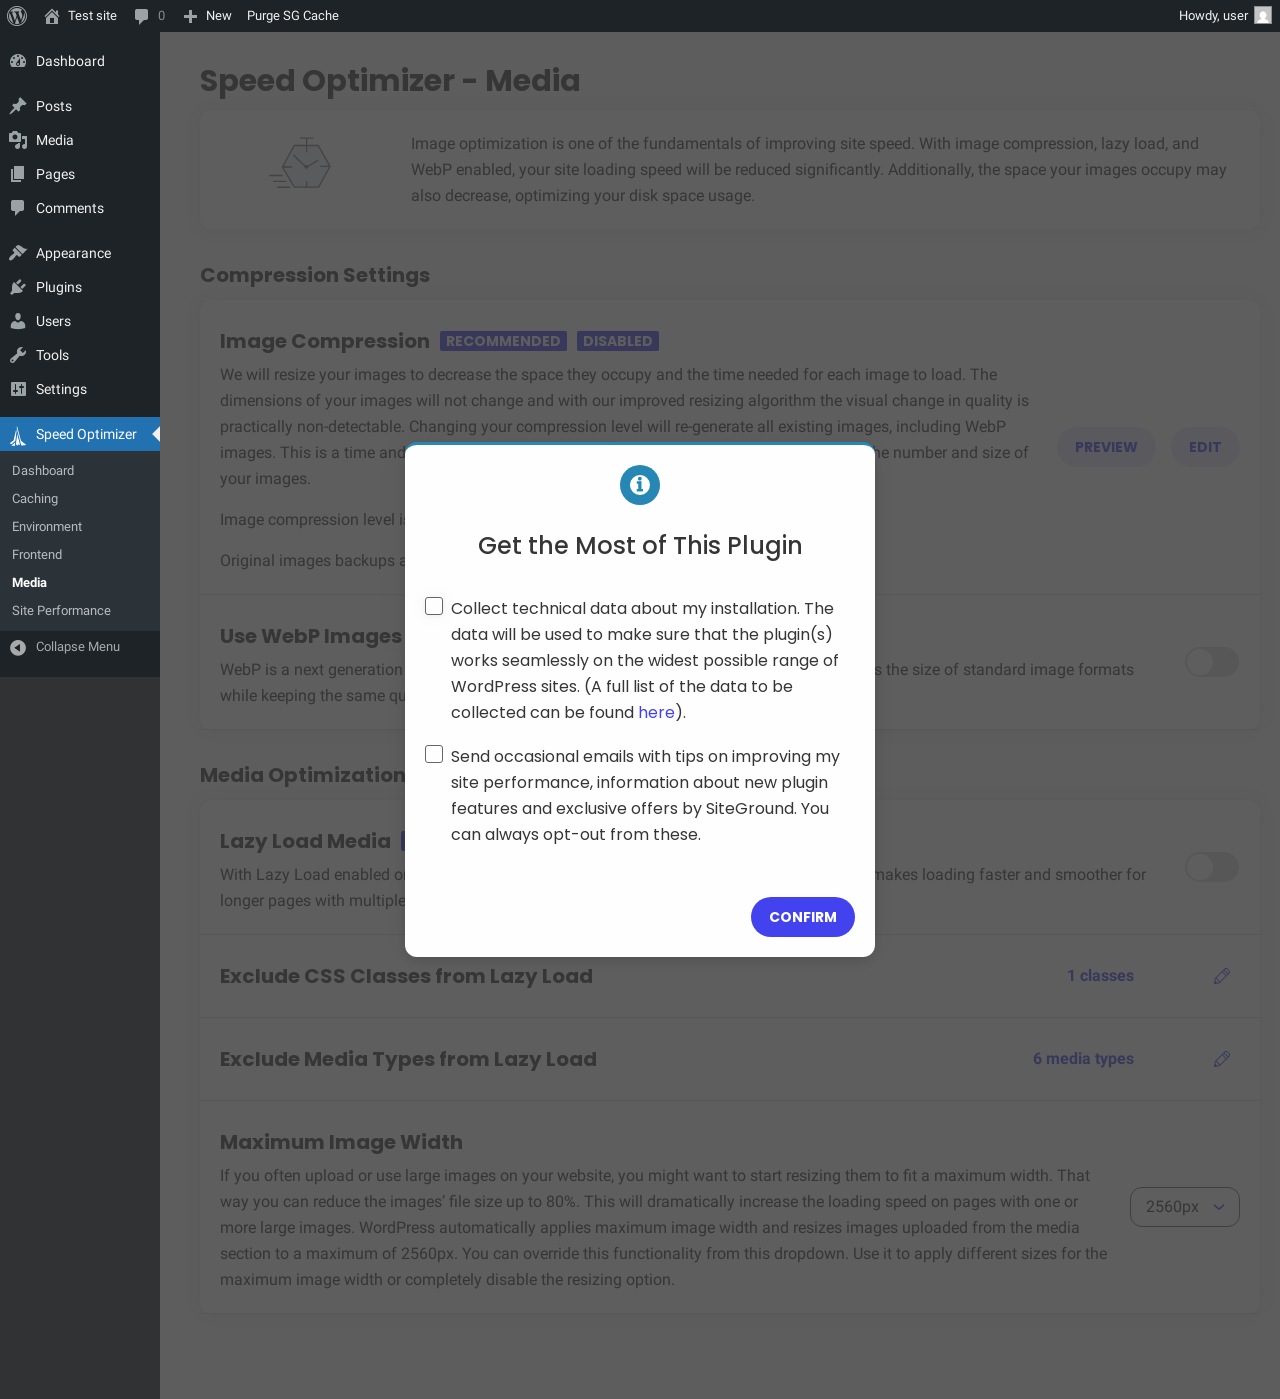
| URL | /wp-admin/admin.php?page=sgo_media |
|---|---|
| Aspect | menu-item |
| HTTP status | 200 |
| Load time | 1.016 s |
| Memory usage | 4.04 MiB |
| JS errors | None |
| Resource errors | None |
Speed Optimizer → Site Performance
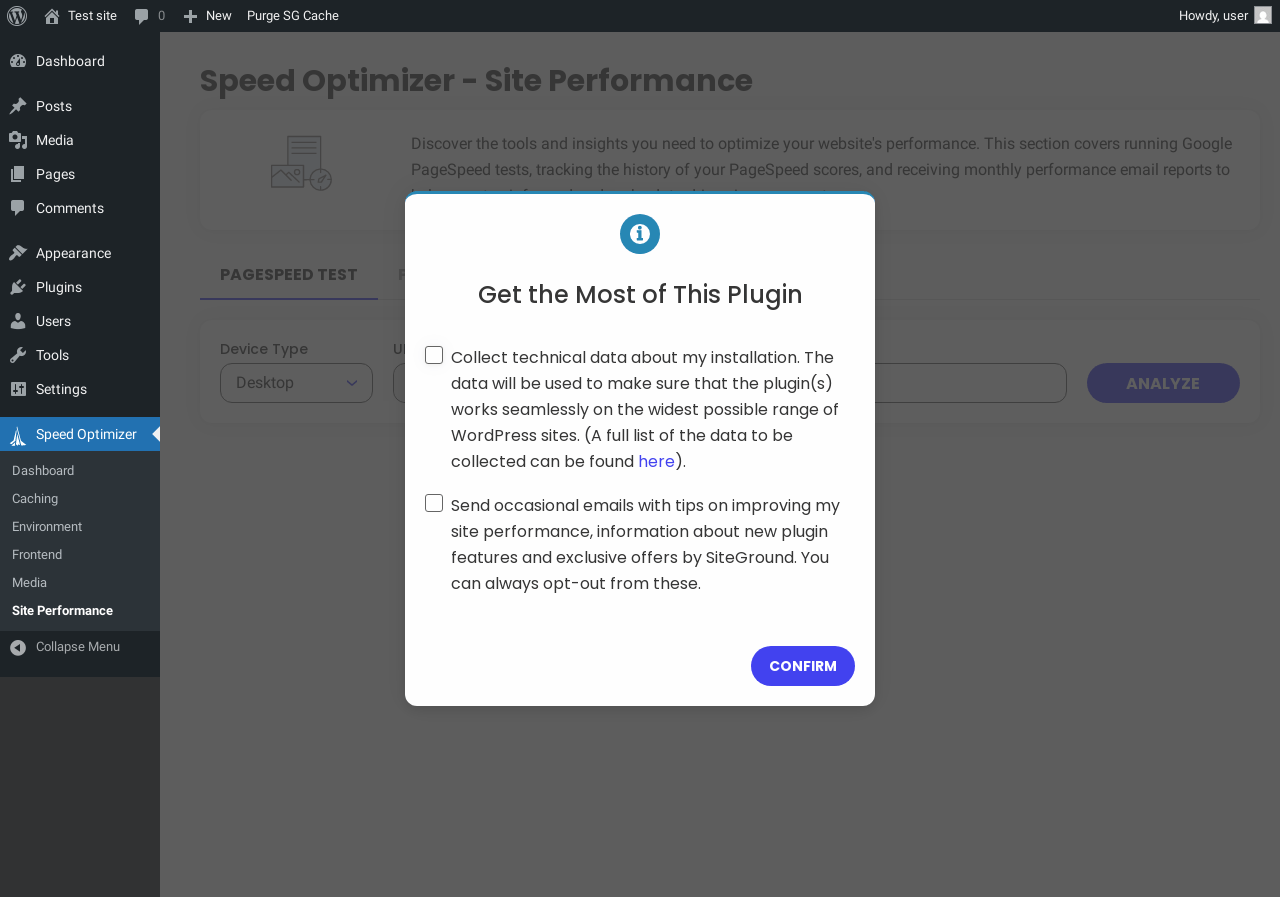
| URL | /wp-admin/admin.php?page=sgo_analysis |
|---|---|
| Aspect | menu-item |
| HTTP status | 200 |
| Load time | 0.636 s |
| Memory usage | 4.04 MiB |
| JS errors | None |
| Resource errors | None |
Test site – Just another WordPress site
| URL | / |
|---|---|
| Aspect | front-page |
| HTTP status | 200 |
| Load time | 0.278 s |
| Memory usage | 4.39 MiB |
| JS errors | None |
| Resource errors | None |
Benchmark
| URL | Load time | Memory usage | ||||
|---|---|---|---|---|---|---|
| Inactive | Active | Change | Inactive | Active | Change | |
| /wp-admin/index.php | 0.625 s | 0.721 s | +0.096 s | 3.92 MiB | 4.17 MiB | + 253.3 KiB |
| /wp-admin/edit.php | 0.562 s | 1.007 s | +0.445 s | 3.98 MiB | 4.16 MiB | + 188.27 KiB |
| /wp-admin/post-new.php | 2.403 s | 1.793 s | -0.610 s | 6.56 MiB | 7.13 MiB | + 588.89 KiB |
| /wp-admin/upload.php | 0.824 s | 1.121 s | +0.297 s | 3.89 MiB | 4.07 MiB | + 184.09 KiB |
| /wp-admin/options-writing.php | 0.571 s | 0.659 s | +0.088 s | 3.86 MiB | 4.03 MiB | + 173.77 KiB |
| /wp-admin/media-new.php | 0.639 s | 0.583 s | -0.056 s | 3.85 MiB | 4.03 MiB | + 181.97 KiB |
| /wp-admin/edit-tags.php?taxonomy=category | 0.554 s | 0.805 s | +0.251 s | 3.86 MiB | 4.05 MiB | + 186.83 KiB |
| /wp-admin/post-new.php?post_type=page | 1.820 s | 1.770 s | -0.050 s | 6.55 MiB | 7.12 MiB | + 581.16 KiB |
| /wp-admin/options-discussion.php | 0.723 s | 0.676 s | -0.047 s | 3.86 MiB | 4.03 MiB | + 169.96 KiB |
| /wp-admin/edit-comments.php | 0.617 s | 0.579 s | -0.038 s | 3.88 MiB | 4.08 MiB | + 198.77 KiB |
| / | 0.358 s | 0.224 s | -0.134 s | 4.23 MiB | 4.39 MiB | + 169.85 KiB |
| Average | 0.881 s | 0.903 s | +0.022 s | 4.4 MiB | 4.66 MiB | + 261.53 KiB |
Code Statistics
Note: Third-party libraries and minified JS/CSS files are excluded from these statistics where possible, so the numbers you see here may be lower than those reported by other tools.
| Language | % | Lines of code | Comment lines | Files | |
|---|---|---|---|---|---|
| PHP | 93.3% | 12,069 | 7,478 | 126 | |
| CSS | 4.4% | 574 | 17 | 1 | |
| JavaScript | 1.2% | 161 | 199 | 2 | |
| Sass | 0.7% | 90 | 0 | 1 | |
| SVG | 0.3% | 35 | 0 | 35 | |
| Total | 12,929 | 7,694 | 165 | ||
PHP Code Analysis | More results »
| Lines of code | 11,065 |
|---|---|
| Total complexity | 1,897 |
| Median class complexity | 6.5 |
| Median method complexity | 3.0 |
| Most complex class | SiteGround_Optimizer\File_Cacher\File_Cacher |
| Most complex function | SiteGround_Optimizer\Analysis\Analysis::process_analysis() |
| Classes | 110 |
|---|---|
| Methods | 557 |
| Functions | 2 |
Additions
Things that the plugin adds to the site. This section is not intended to be comprehensive. The test tool only looks for a few specific types of added content.
Options wp_options 43
- sg_cachepress
- sgo_install_7_4_0
- siteground_optimizer_async_javascript_exclude
- siteground_optimizer_autoflush_cache
- siteground_optimizer_checked_nginx
- siteground_optimizer_combine_css
- siteground_optimizer_current_version
- siteground_optimizer_database_optimization
- siteground_optimizer_default_autoflush_cache
- siteground_optimizer_default_enable_cache
- siteground_optimizer_disable_emojis
- siteground_optimizer_enable_browser_caching
- siteground_optimizer_enable_cache
- siteground_optimizer_enable_gzip_compression
- siteground_optimizer_enable_memcached
- siteground_optimizer_excluded_lazy_load_classes
- siteground_optimizer_excluded_lazy_load_media_types
- siteground_optimizer_first_run
- siteground_optimizer_heartbeat_dashboard_interval
- siteground_optimizer_heartbeat_frontend_interval
- siteground_optimizer_heartbeat_post_interval
- siteground_optimizer_image_optimization_completed
- siteground_optimizer_is_nginx
- siteground_optimizer_last_fail
- siteground_optimizer_optimize_css
- siteground_optimizer_optimize_html
- siteground_optimizer_optimize_javascript
- siteground_optimizer_optimize_javascript_async
- siteground_optimizer_performace_receipient
- siteground_optimizer_phpcompat_is_compatible
- siteground_optimizer_phpcompat_progress
- siteground_optimizer_phpcompat_result
- siteground_optimizer_phpcompat_status
- siteground_optimizer_quality_type
- siteground_optimizer_quality_webp
- siteground_optimizer_remove_query_strings
- siteground_optimizer_show_notice
- siteground_optimizer_ssl_enabled
- siteground_optimizer_supercacher_permissions
- siteground_optimizer_update_timestamp
- siteground_optimizer_version
- siteground_optimizer_whats_new
- siteground_settings_optimizer_hello
PHP Error Log
The log file is empty.