Speed Optimizer 7.8.1
Does Speed Optimizer work with WordPress 7.0.3 and PHP 8.1.12? A smoke test was performed on .
Summary
| 1 | PHP notices |
| No JavaScript exceptions | |
| All test pages loaded successfully | |
| No resource errors |
Memory usage: 260.1 KiB
The average PHP memory usage increased by this amount after activating by the plugin.
Page speed impact:
insignificant.
The plugin didn't make the site noticeably slower.
| WordPress version | 7.0.3 |
|---|---|
| PHP version | 8.1.12 |
| MySQL version | 10.6.10 |
| PHP memory limit | 512M |
| Last updated | |
|---|---|
| Active installs | 1,000,000+ |
| WordPress.org page | https://wordpress.org/plugins/sg-cachepress/ |
| Badges |
|


Pages 9
Plugins ‹ Test site — WordPress
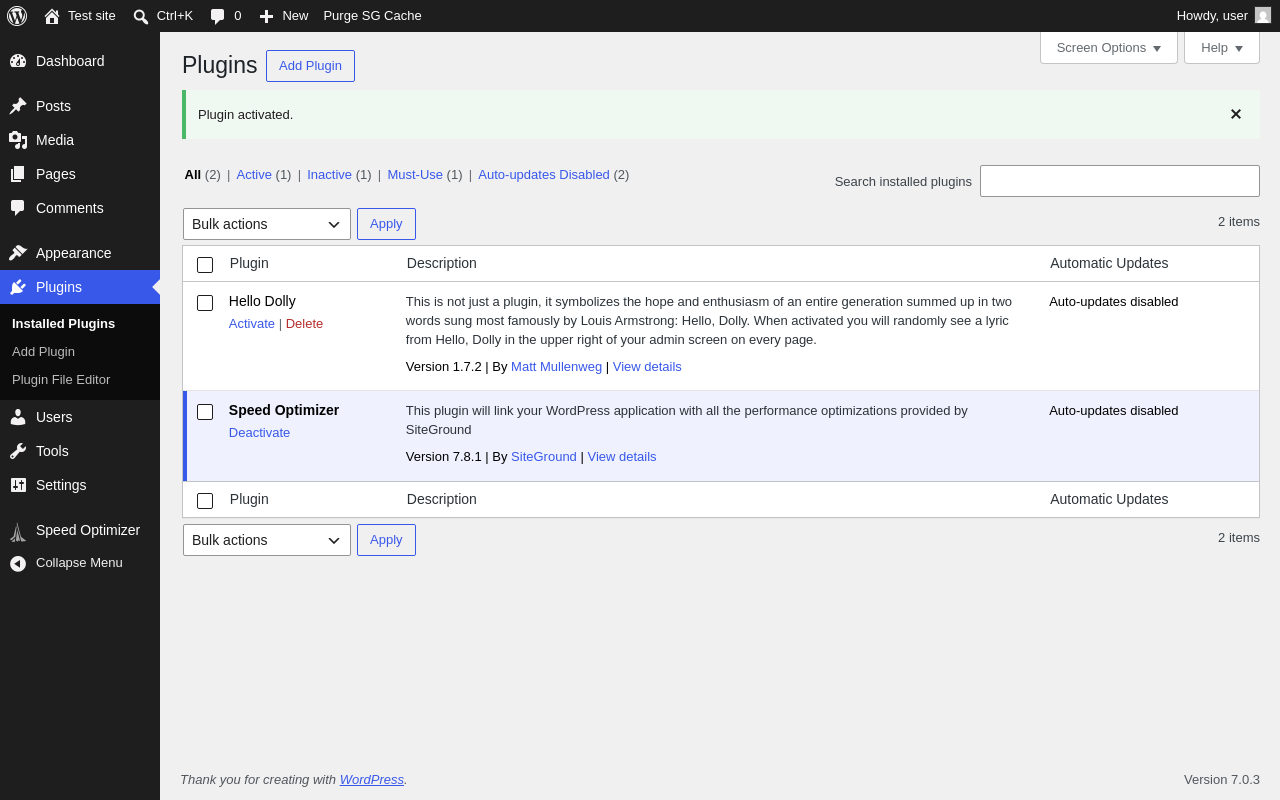
| URL | /wp-admin/plugins.php?plugin_status=all&paged=1&s |
|---|---|
| Requested URL | /wp-admin/plugins.php?action=activate&plugin=sg-cachepress%2Fsg-cachepress.php&plugin_status=all&paged=1&s&_wpnonce=0f16c2168c |
| Aspect | after-activation |
| HTTP status | 200 |
| Load time | 1.273 s |
| Memory usage | 4.13 MiB |
| JS errors | None |
| Resource errors | None |
Settings → SG Plugins
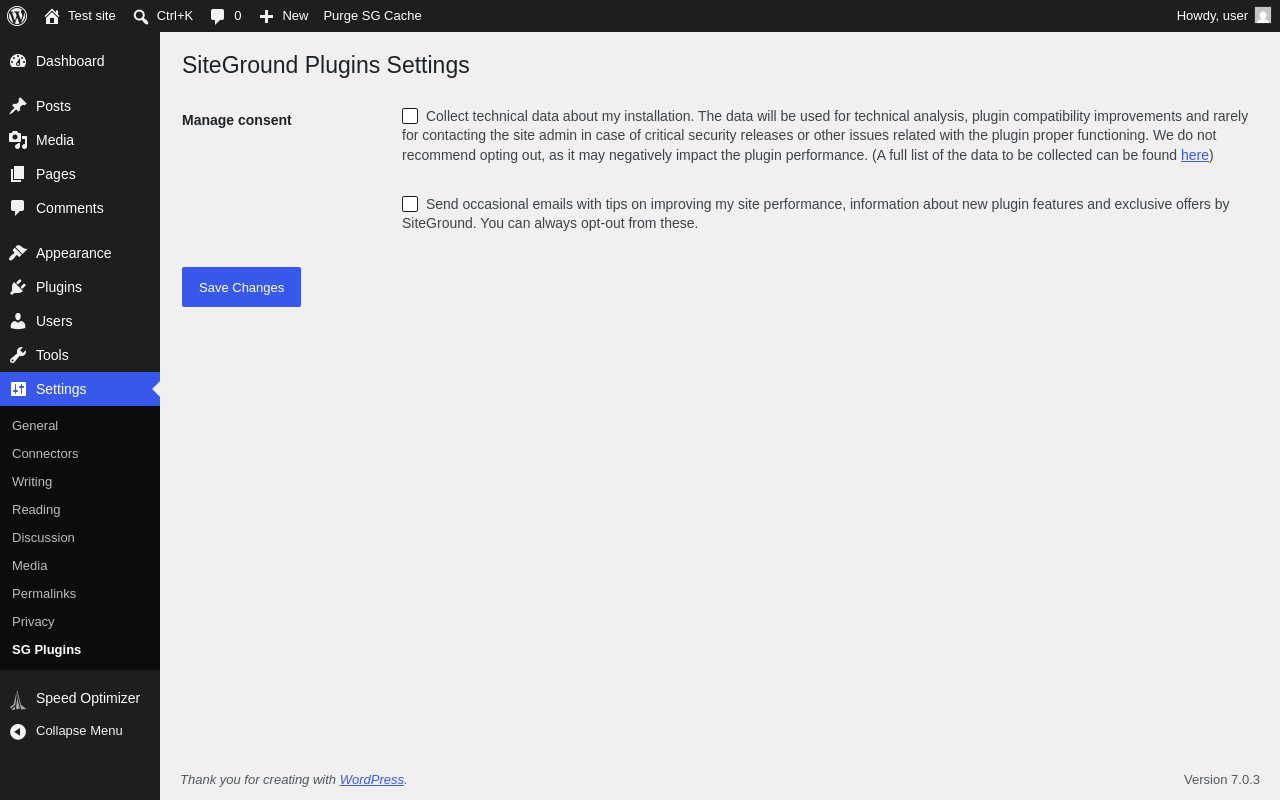
| URL | /wp-admin/options-general.php?page=siteground_settings |
|---|---|
| Aspect | menu-item |
| HTTP status | 200 |
| Load time | 0.460 s |
| Memory usage | 4.05 MiB |
| JS errors | None |
| Resource errors | None |
Speed Optimizer

| URL | /wp-admin/admin.php?page=sg-cachepress |
|---|---|
| Aspect | menu-item |
| HTTP status | 200 |
| Load time | 0.935 s |
| Memory usage | 4.06 MiB |
| JS errors | None |
| Resource errors | None |
Speed Optimizer → Caching
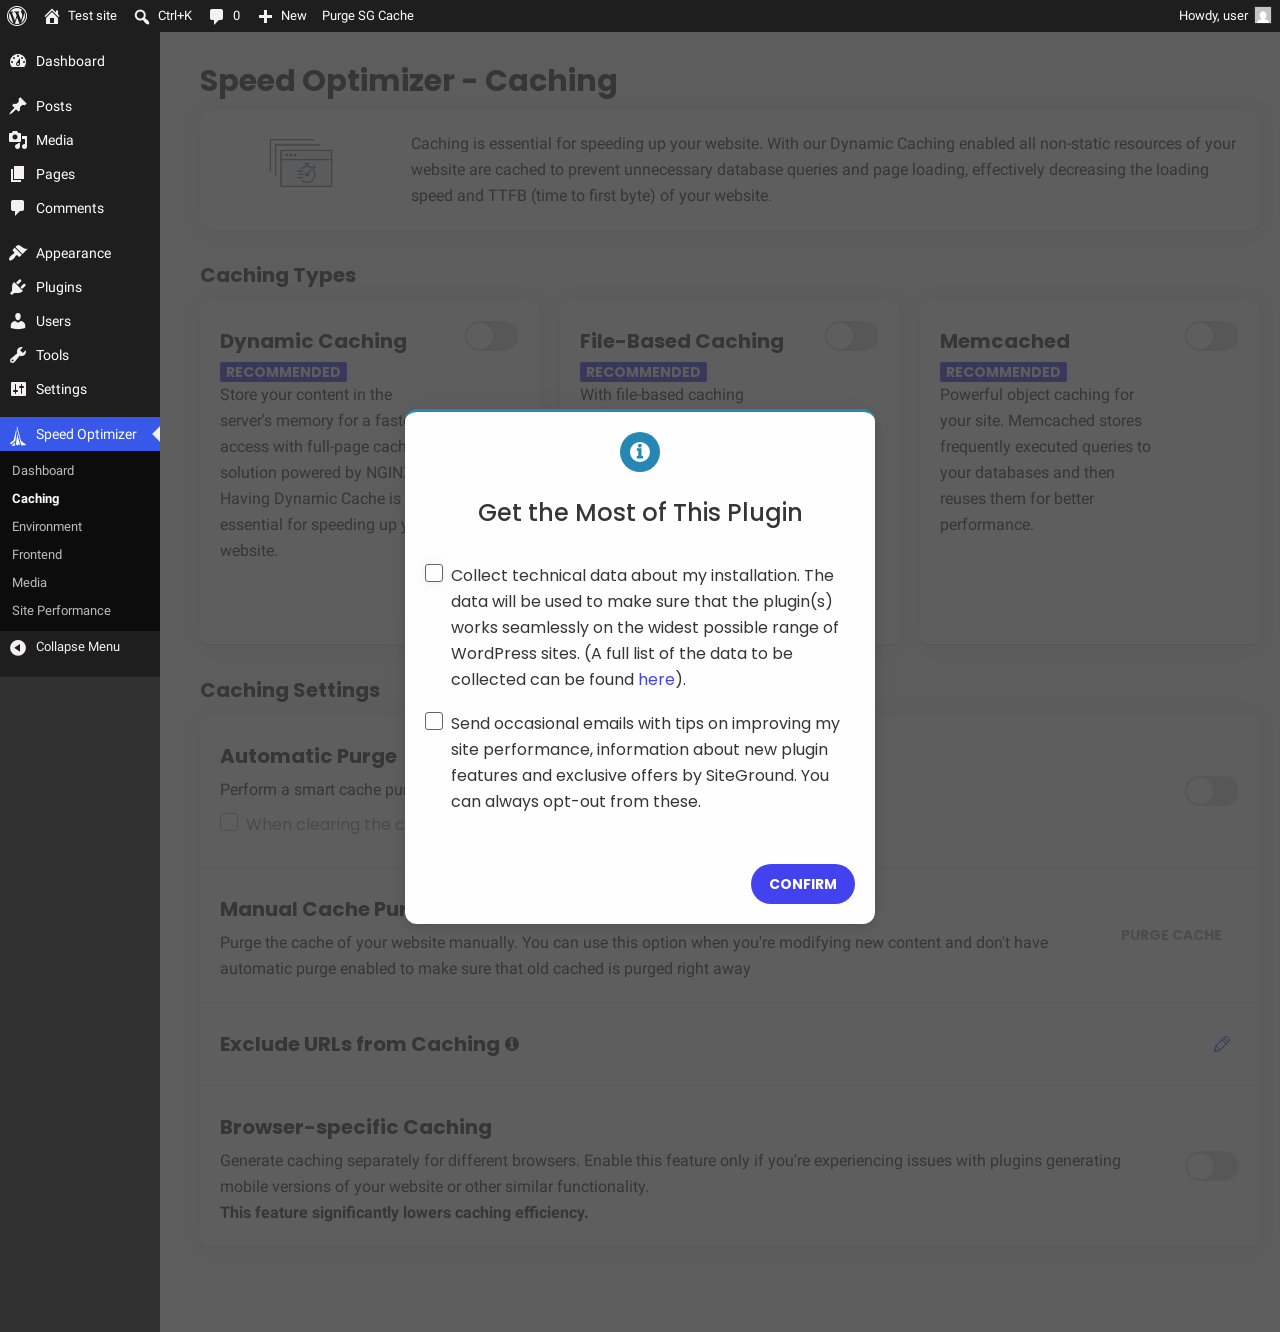
| URL | /wp-admin/admin.php?page=sgo_caching |
|---|---|
| Aspect | menu-item |
| HTTP status | 200 |
| Load time | 0.965 s |
| Memory usage | 4.04 MiB |
| JS errors | None |
| Resource errors | None |
Speed Optimizer → Environment

| URL | /wp-admin/admin.php?page=sgo_environment |
|---|---|
| Aspect | menu-item |
| HTTP status | 200 |
| Load time | 0.722 s |
| Memory usage | 4.04 MiB |
| JS errors | None |
| Resource errors | None |
Speed Optimizer → Frontend
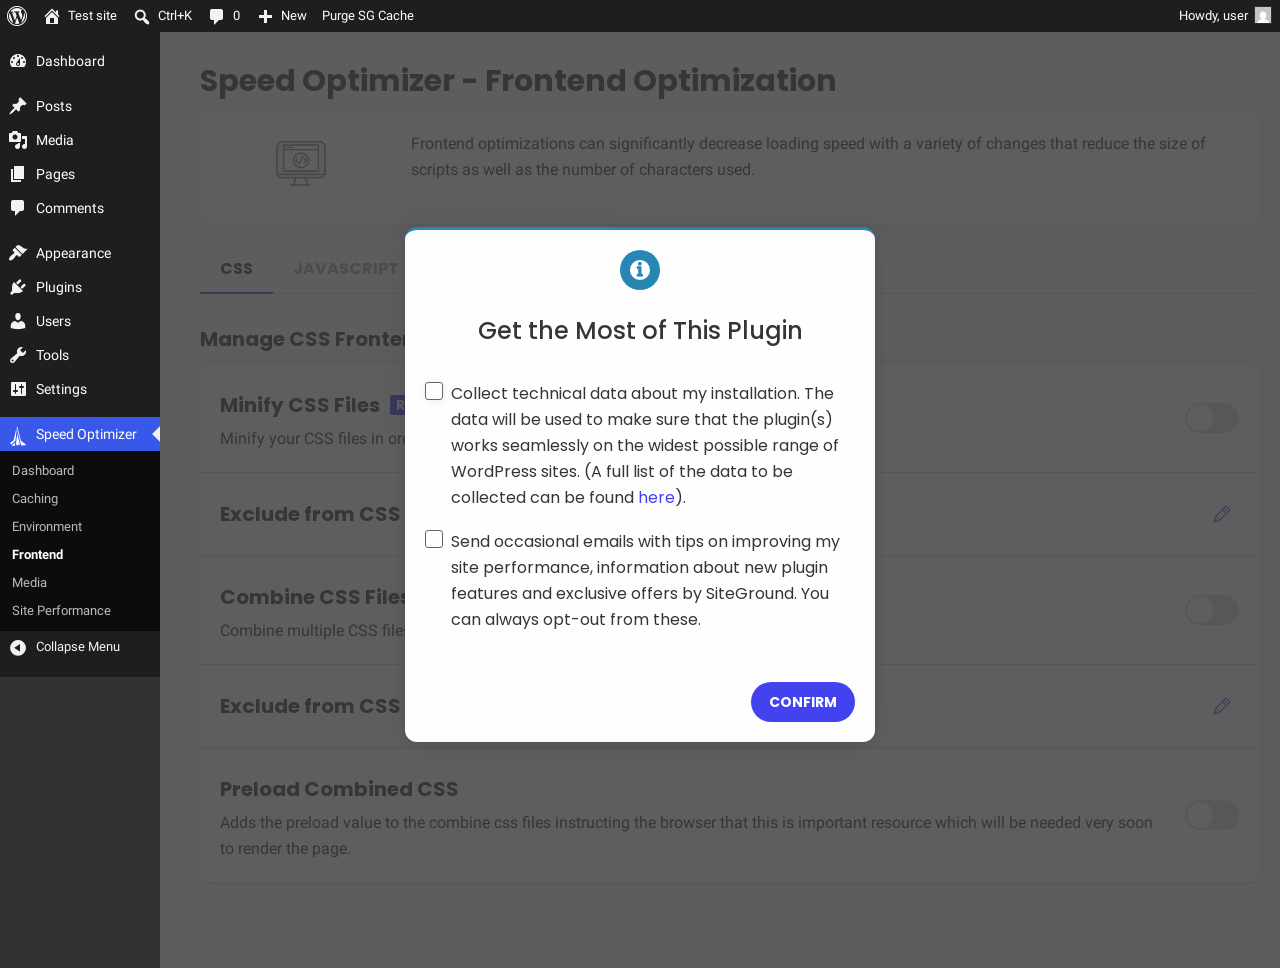
| URL | /wp-admin/admin.php?page=sgo_frontend |
|---|---|
| Aspect | menu-item |
| HTTP status | 200 |
| Load time | 0.730 s |
| Memory usage | 4.04 MiB |
| JS errors | None |
| Resource errors | None |
Speed Optimizer → Media

| URL | /wp-admin/admin.php?page=sgo_media |
|---|---|
| Aspect | menu-item |
| HTTP status | 200 |
| Load time | 0.937 s |
| Memory usage | 4.04 MiB |
| JS errors | None |
| Resource errors | None |
Speed Optimizer → Site Performance
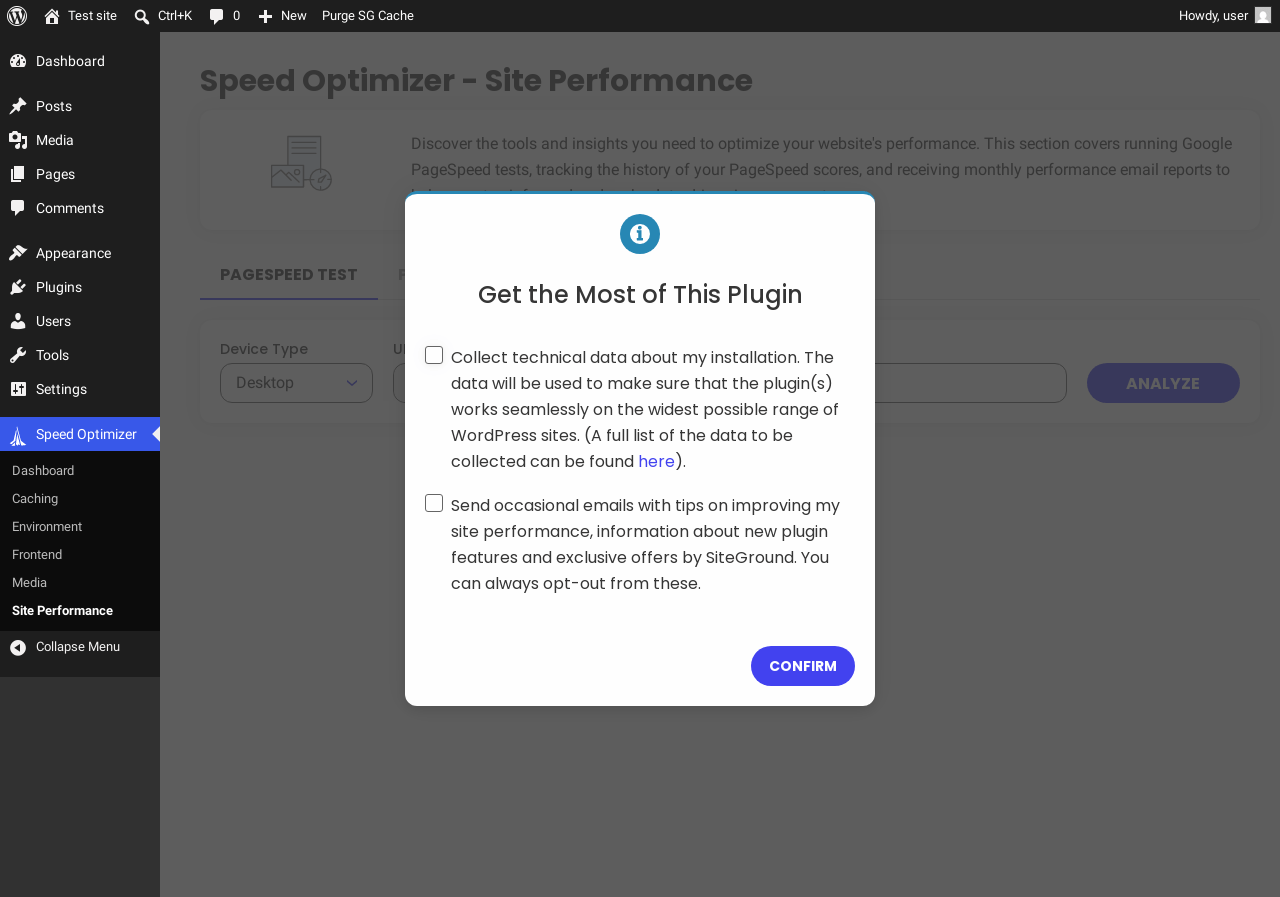
| URL | /wp-admin/admin.php?page=sgo_analysis |
|---|---|
| Aspect | menu-item |
| HTTP status | 200 |
| Load time | 0.650 s |
| Memory usage | 4.04 MiB |
| JS errors | None |
| Resource errors | None |
Test site – Just another WordPress site
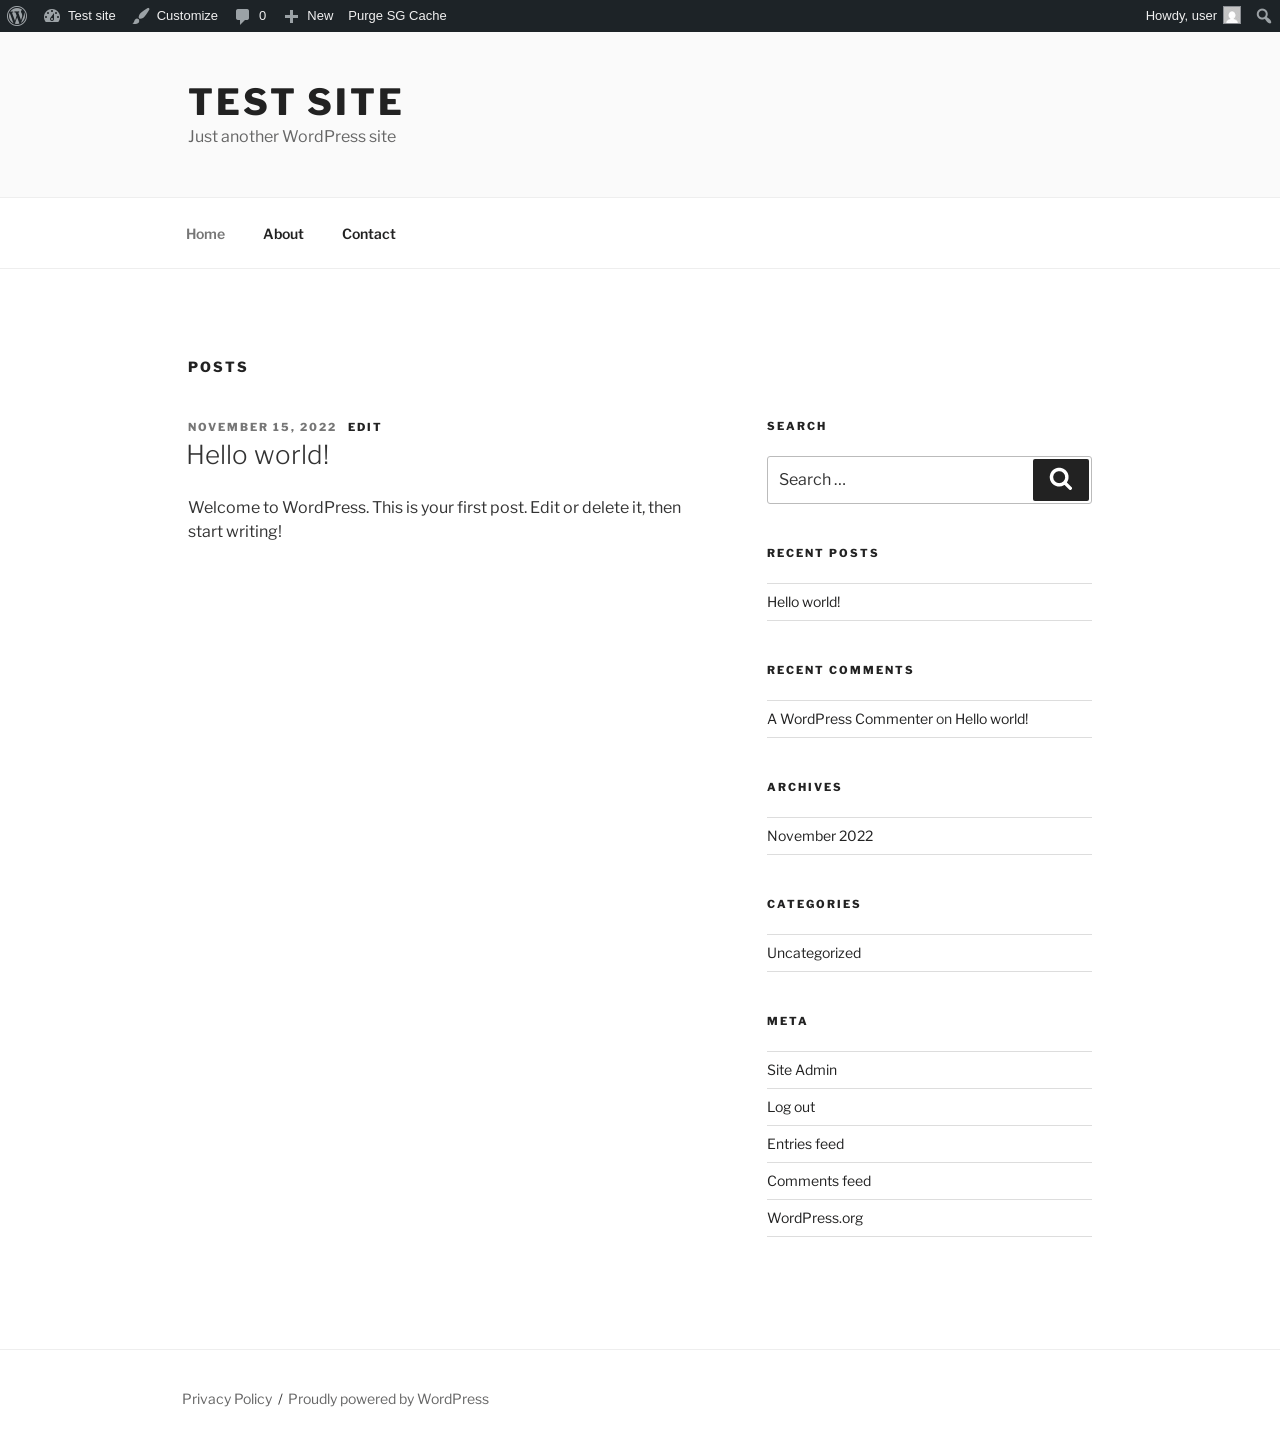
| URL | / |
|---|---|
| Aspect | front-page |
| HTTP status | 200 |
| Load time | 0.249 s |
| Memory usage | 4.39 MiB |
| JS errors | None |
| Resource errors | None |
Benchmark
| URL | Load time | Memory usage | ||||
|---|---|---|---|---|---|---|
| Inactive | Active | Change | Inactive | Active | Change | |
| /wp-admin/index.php | 0.631 s | 0.636 s | +0.005 s | 3.93 MiB | 4.17 MiB | + 251.66 KiB |
| /wp-admin/edit.php | 0.527 s | 0.719 s | +0.192 s | 3.98 MiB | 4.16 MiB | + 186.73 KiB |
| /wp-admin/post-new.php | 1.994 s | 1.581 s | -0.413 s | 6.56 MiB | 7.13 MiB | + 587.27 KiB |
| /wp-admin/upload.php | 0.741 s | 0.674 s | -0.067 s | 3.89 MiB | 4.07 MiB | + 182.45 KiB |
| /wp-admin/options-writing.php | 0.530 s | 0.543 s | +0.013 s | 3.86 MiB | 4.03 MiB | + 172.14 KiB |
| /wp-admin/media-new.php | 0.564 s | 0.898 s | +0.334 s | 3.85 MiB | 4.03 MiB | + 180.34 KiB |
| /wp-admin/edit-tags.php?taxonomy=category | 0.495 s | 0.535 s | +0.040 s | 3.86 MiB | 4.05 MiB | + 185.2 KiB |
| /wp-admin/post-new.php?post_type=page | 1.794 s | 1.781 s | -0.013 s | 6.55 MiB | 7.11 MiB | + 579.52 KiB |
| /wp-admin/options-discussion.php | 0.751 s | 0.599 s | -0.152 s | 3.86 MiB | 4.03 MiB | + 168.33 KiB |
| /wp-admin/edit-comments.php | 0.537 s | 0.514 s | -0.023 s | 3.89 MiB | 4.08 MiB | + 197.13 KiB |
| / | 0.283 s | 0.212 s | -0.071 s | 4.23 MiB | 4.39 MiB | + 170.3 KiB |
| Average | 0.804 s | 0.790 s | -0.014 s | 4.41 MiB | 4.66 MiB | + 260.1 KiB |
Code Statistics
Note: Third-party libraries and minified JS/CSS files are excluded from these statistics where possible, so the numbers you see here may be lower than those reported by other tools.
| Language | % | Lines of code | Comment lines | Files | |
|---|---|---|---|---|---|
| PHP | 93.5% | 12,280 | 7,570 | 126 | |
| CSS | 4.4% | 574 | 17 | 1 | |
| JavaScript | 1.2% | 161 | 199 | 2 | |
| Sass | 0.7% | 90 | 0 | 1 | |
| SVG | 0.3% | 35 | 0 | 35 | |
| Total | 13,140 | 7,786 | 165 | ||
PHP Code Analysis | More results »
| Lines of code | 11,227 |
|---|---|
| Total complexity | 1,943 |
| Median class complexity | 7.0 |
| Median method complexity | 3.0 |
| Most complex class | SiteGround_Optimizer\File_Cacher\File_Cacher |
| Most complex function | SiteGround_Optimizer\Analysis\Analysis::process_analysis() |
| Classes | 110 |
|---|---|
| Methods | 571 |
| Functions | 2 |
Additions
Things that the plugin adds to the site. This section is not intended to be comprehensive. The test tool only looks for a few specific types of added content.
Options wp_options 43
- sg_cachepress
- sgo_install_7_4_0
- siteground_optimizer_async_javascript_exclude
- siteground_optimizer_autoflush_cache
- siteground_optimizer_checked_nginx
- siteground_optimizer_combine_css
- siteground_optimizer_current_version
- siteground_optimizer_database_optimization
- siteground_optimizer_default_autoflush_cache
- siteground_optimizer_default_enable_cache
- siteground_optimizer_disable_emojis
- siteground_optimizer_enable_browser_caching
- siteground_optimizer_enable_cache
- siteground_optimizer_enable_gzip_compression
- siteground_optimizer_enable_memcached
- siteground_optimizer_excluded_lazy_load_classes
- siteground_optimizer_excluded_lazy_load_media_types
- siteground_optimizer_first_run
- siteground_optimizer_heartbeat_dashboard_interval
- siteground_optimizer_heartbeat_frontend_interval
- siteground_optimizer_heartbeat_post_interval
- siteground_optimizer_image_optimization_completed
- siteground_optimizer_is_nginx
- siteground_optimizer_last_fail
- siteground_optimizer_optimize_css
- siteground_optimizer_optimize_html
- siteground_optimizer_optimize_javascript
- siteground_optimizer_optimize_javascript_async
- siteground_optimizer_performace_receipient
- siteground_optimizer_phpcompat_is_compatible
- siteground_optimizer_phpcompat_progress
- siteground_optimizer_phpcompat_result
- siteground_optimizer_phpcompat_status
- siteground_optimizer_quality_type
- siteground_optimizer_quality_webp
- siteground_optimizer_remove_query_strings
- siteground_optimizer_show_notice
- siteground_optimizer_ssl_enabled
- siteground_optimizer_supercacher_permissions
- siteground_optimizer_update_timestamp
- siteground_optimizer_version
- siteground_optimizer_whats_new
- siteground_settings_optimizer_hello
PHP Error Log 1 lines
[12-Aug-2026 08:14:06 UTC] PHP Notice: Function _load_textdomain_just_in_time was called <strong>incorrectly</strong>. Translation loading for the <code>sg-cachepress</code> domain was triggered too early. This is usually an indicator for some code in the plugin or theme running too early. Translations should be loaded at the <code>init</code> action or later. Please see <a href="https://developer.wordpress.org/advanced-administration/debug/debug-wordpress/">Debugging in WordPress</a> for more information. (This message was added in version 6.7.0.) in /wp-includes/functions.php on line 6170